
Why Meeting Room Analytics Matter in 2026

TL;DR
- Office utilization climbed to 56% globally in 2026, up from 49% in 2024 (JLL) - more people are back in the building, which makes room-level data more urgent, not less.
- A healthy meeting room utilization rate is generally 40-60% of core business hours; rooms running far outside that range are either wasted real estate or a source of daily booking conflicts.
- Recent meeting-pattern data shows most meetings are small and short - 64% involve six or fewer people, and median duration is just 35 minutes (Flowtrace) - which is the strongest available evidence that most offices are oversized for how teams actually meet.
- Utilization (how often a room is used) and occupancy (how many people use it relative to capacity) are different metrics that point to different fixes.
- The most common form of waste is the “ghost meeting” - a room reserved but never used - which auto-release policies are designed to eliminate.
- YAROOMS, Robin, Archie, and Kadence are the top platforms for meeting room analytics in 2026, connecting room data with broader workplace insights.
What Are Meeting Room Analytics?
Meeting room analytics (or conference room analytics) track how meeting spaces are actually used by combining data from booking systems, occupancy sensors, badge readers, and calendar integrations. They measure two distinct things:
- Utilization - how often a room is booked and occupied relative to its available hours.
- Occupancy - how many people actually use a room relative to its capacity.
These analytics answer questions that booking calendars alone can’t:
- Which rooms are booked but consistently sit empty?
- What’s the average gap between scheduled meeting length and actual meeting length?
- Are 10-person rooms regularly used by teams of two or three?
- Which rooms and time slots see the most scheduling conflicts?
- How does actual usage compare to what’s on the calendar?
By tracking the gap between intent (the booking) and reality (the occupancy), organizations can right-size their room mix, cut wasted real estate spend, and reduce the daily friction of hunting for an available room. That distinction between intent and reality is also why the two terms below get measured separately rather than treated as one number.
Utilization vs. Occupancy: Why the Distinction Matters
These two terms get used interchangeably, but they measure different problems. A room can show high utilization - booked 70% of the day - while still having poor occupancy, if it’s a 10-person boardroom that only ever holds three people. High utilization with low occupancy points to a room-sizing problem, not a capacity problem. Low utilization on its own points to a room you may not need at all. Tracking both is what tells you which lever to pull.
The Context That Makes This Urgent Right Now
Two recent, independent data points change how this problem should be read in 2026 - and neither shows up in most meeting room analytics content.
Offices are filling back up, fast. JLL’s 2026 Global Occupancy Planning Benchmark Report puts global office utilization at 56%, up from 54% in 2025 and 49% in 2024 - the largest single-year jump in three years of tracking, driven by a surge in employees attending three to four days a week (from 36% to 55% year over year). The gap between actual and target utilization has also narrowed from 25 points to 18, meaning organizations are setting more realistic targets rather than just waiting for attendance to catch up.
What this means for meeting rooms specifically: more bodies in the building means more pressure on shared spaces, and a room mix calibrated for 2023-2024 office attendance levels is now being tested by meaningfully higher daily occupancy. If your room data is more than a year old, it’s describing an office that no longer exists.
Most meetings don’t need a boardroom. Separately, Flowtrace’s analysis of 1.3 million real meetings found that 64% of meetings have six or fewer participants, only 8% exceed ten people, and the median meeting now runs just 35 minutes - with 94% of all meetings booked for an hour or less. That’s a direct, current answer to the “are large rooms used for small meetings” question that most meeting room analytics content treats as a hypothesis. It isn’t a hypothesis. It’s the dominant pattern.
Put together: demand for in-person collaboration is rising, but the typical meeting is smaller and shorter than most room inventories were built for. That combination - more people, in smaller groups, for less time - is exactly the mismatch that meeting room analytics are designed to expose and correct.
How Do Meeting Room Analytics Work?
Meeting room analytics platforms pull data from a combination of sources, and the mix determines how closely the data reflects what actually happened in a room versus what was simply requested:
- Booking systems: Calendar integrations with Outlook, Google Calendar, or dedicated room booking software capture what’s been reserved - by whom, for how long, and for how many attendees. On their own, these systems log what was requested.
- Occupancy sensors: Hardware sensors (commonly PIR/infrared, ultrasonic, or camera-based) detect whether a room is physically occupied, independent of the calendar.
- Badge data: Access control integration shows when someone physically enters a room and how long they stay, adding a layer between booking and sensor data.
- Check-in systems: Many booking platforms require a mobile or room panel check-in to confirm a booking is actually being used; if no one checks in within a set window, the system auto-releases the room.
That last point matters more than it sounds. A plain calendar invite only tells you what was requested. But a booking platform with check-in and auto-release built in - like YAROOMS - tells you what actually happened. Every booking ends one of three ways: someone checks in and uses the room, no one checks in and the room is released back into the pool, or it’s cancelled ahead of time. The platform logs which one occurred, so you get real no-show data without installing a single sensor.
Sensors and badge data add an extra layer on top - they can tell you exactly how many people are in a room, which is useful for spotting oversized spaces. But the basic question of “was this room actually used or not” is already answered by a good booking system on its own.
The combination of all these sources is what powers the reports below: no-show rates, true usage versus what was booked, and patterns in how different rooms get used.
Key Meeting Room Metrics to Track
- Utilization rate: Hours a room is actually occupied, divided by total available hours. The standard formula: Utilization Rate = (Hours Occupied ÷ Total Available Hours) × 100.
- Occupancy vs. capacity: Average headcount in a room compared to its stated capacity - the metric that flags oversized or undersized rooms.
- No-show rate: The share of bookings where the room was reserved but never used.
- Meeting length accuracy: Scheduled duration versus actual duration, which shows whether default booking intervals match real meeting behavior.
- Peak usage times: The days and hours where demand concentrates, used to plan capacity and booking policies.
What’s a Healthy Meeting Room Utilization Rate?
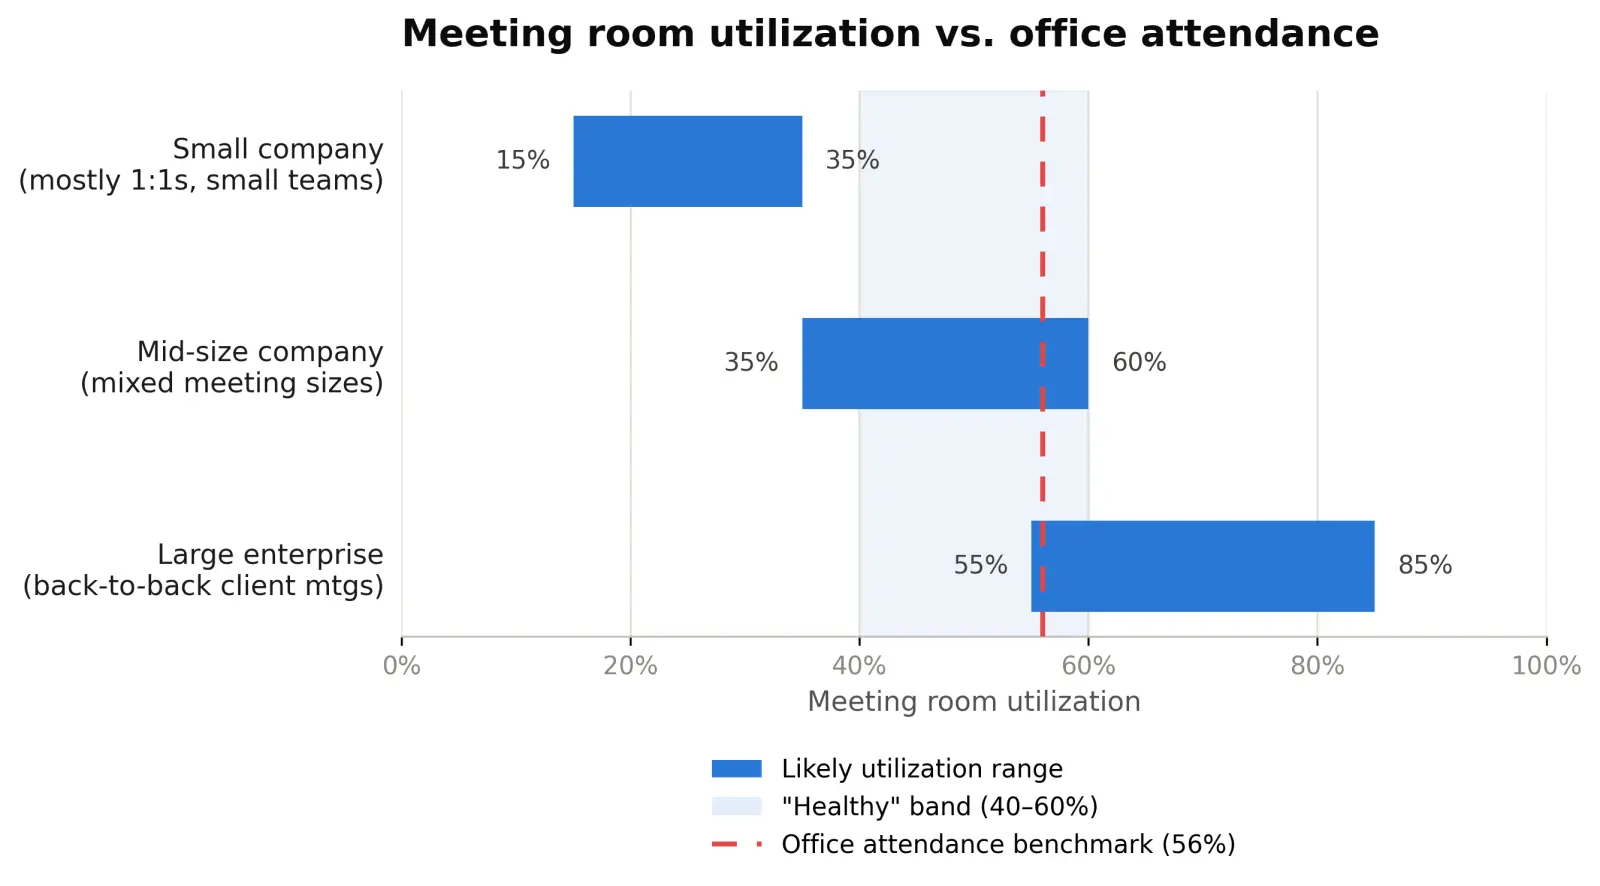
Industry sources converge on a target range of roughly 40-60% of core business hours for meeting room utilization. Below that range, you likely have more room capacity than your organization needs. Above it, employees are more likely to hit double bookings and run out of available space during peak hours. This range is lower than what’s typical for desks, since meeting rooms are designed for intermittent, scheduled use rather than continuous occupancy throughout the day.
Treat this as a benchmark to test against your own data, not a fixed target. The figure above describe overall office attendance, not meeting room utilization specifically - the two move together but aren’t the same number, and a building running at 56% occupancy can still have meeting rooms running well outside the 40-60% band in either direction. A 100-person company with mostly small team meetings will look very different from a 5,000-person enterprise running back-to-back client presentations.
Why Meeting Room Analytics Matter in 2026
In 2026, meeting room data isn’t just an efficiency exercise - it changes how leaders make space decisions in four concrete ways.
They Expose the Real Cost of Underused Space
When a room is booked solid on the calendar but sits empty when you walk past it, you’re paying full real estate cost - rent, utilities, maintenance - for a fraction of the value. Comparing booking data against sensor data lets you calculate the actual cost per productive meeting hour for a room, rather than just its cost per square foot. That distinction is what tells you whether a room is earning its space or draining the budget.
They Reveal Patterns Booking Calendars Hide
Office usage follows predictable weekly rhythms - certain rooms fill up every Tuesday morning and sit empty every Friday afternoon. Calendar data alone won’t show you this clearly because it only reflects what was booked, not what happened. Meeting room analytics expose these rhythms over time, which is what makes it possible to adjust policies - shifting access priority during peak hours, for instance, or repurposing space during predictable lulls, based on actual demand instead of guesswork.
They Support Better Real Estate Decisions
Most offices end up with a room mix that doesn’t match how teams actually meet - too many large boardrooms, not enough small huddle spaces, or the reverse. If roughly two-thirds of meetings involve six people or fewer, a room inventory weighted toward 10-12 person boardrooms is, by definition, mismatched to demand for most of the day. Usage data turns that from a guess into a specific renovation or reallocation plan.
They Reduce the Daily Friction of Finding a Room
A common source of employee frustration is a calendar that looks fully booked while half the rooms behind those bookings sit empty - reserved “just in case” and never released. Auto-release policies, which free up a room automatically if no one checks in within a set window (commonly 10-15 minutes), convert these ghost bookings back into available space without requiring anyone to manually cancel.
Implementing Meeting Room Analytics: A Practical Path
Rolling out meeting room analytics well is less about the tool and more about the sequence - skipping the early steps below is the most common reason a rollout produces data nobody trusts or acts on.
Audit Your Current Room Inventory Against Actual Meeting Size
Before adding any tooling, document what you have: room capacity, office amenities (AV equipment, whiteboards, video conferencing), location, and current booking rules. Then check that inventory against your own meeting size data, not assumptions - if your numbers resemble the broader pattern (most meetings under six people, under 45 minutes), that’s an early signal of where the mismatch will show up before you’ve spent anything on sensors.
Set Clear Goals Before Choosing a Tool
Decide what you’re optimizing for. If the goal is real estate cost reduction, prioritize utilization rate and cost-per-meeting-hour. If the goal is employee experience, prioritize no-show rate and time spent searching for available rooms. The goal determines which features actually matter when comparing platforms - calendar integration depth, sensor support, or reporting flexibility.
Establish a Baseline Before Changing Anything
Track your key metrics for at least 30 days before making changes, so the baseline accounts for normal weekly variation rather than one unusually quiet or busy stretch. This baseline is also what makes a later case for change persuasive - a dashboard showing booked-versus-actual usage over a month is more convincing to stakeholders than a single day’s snapshot.
Communicate Before You Roll Out
Analytics initiatives land better when employees understand the “why” up front. Be specific that sensor and occupancy data track room usage, not individual behavior - the goal is identifying which types of rooms are underused, not monitoring which people book and skip meetings. Pair this with simple guidance: cancel bookings you no longer need, pick an appropriately sized room, and check in if your system requires it.
Review and Iterate Monthly
Treat the first rollout as a starting point, not a finished system. Common adjustments once data comes in: reconfiguring oversized rooms that consistently host small meetings, tightening default booking durations to match actual meeting length, redistributing high-demand amenities (like video conferencing gear) to more rooms, and converting chronically underused large rooms into smaller, more flexible spaces.
Common Obstacles With Conference Room Analytics (And How to Handle Them)
Even a well-planned rollout tends to hit the same three friction points.
- Network and integration friction: Sensor hardware and booking software both need to talk to your existing network and calendar systems cleanly. Loop in IT early rather than discovering compatibility gaps after rollout.
- Employee resistance: New tracking, even when it’s about rooms and not people, can trigger pushback. Clear communication about scope and purpose (see step 4 above) does more to defuse this than any feature of the tool itself.
- Reliability and data trust: If the data is wrong or the system goes down often, people stop trusting it and revert to old habits. Prioritize platforms with a track record on uptime and data accuracy over ones that just have the most dashboards.
Why Meeting Room Data Shouldn’t Live on Its Own
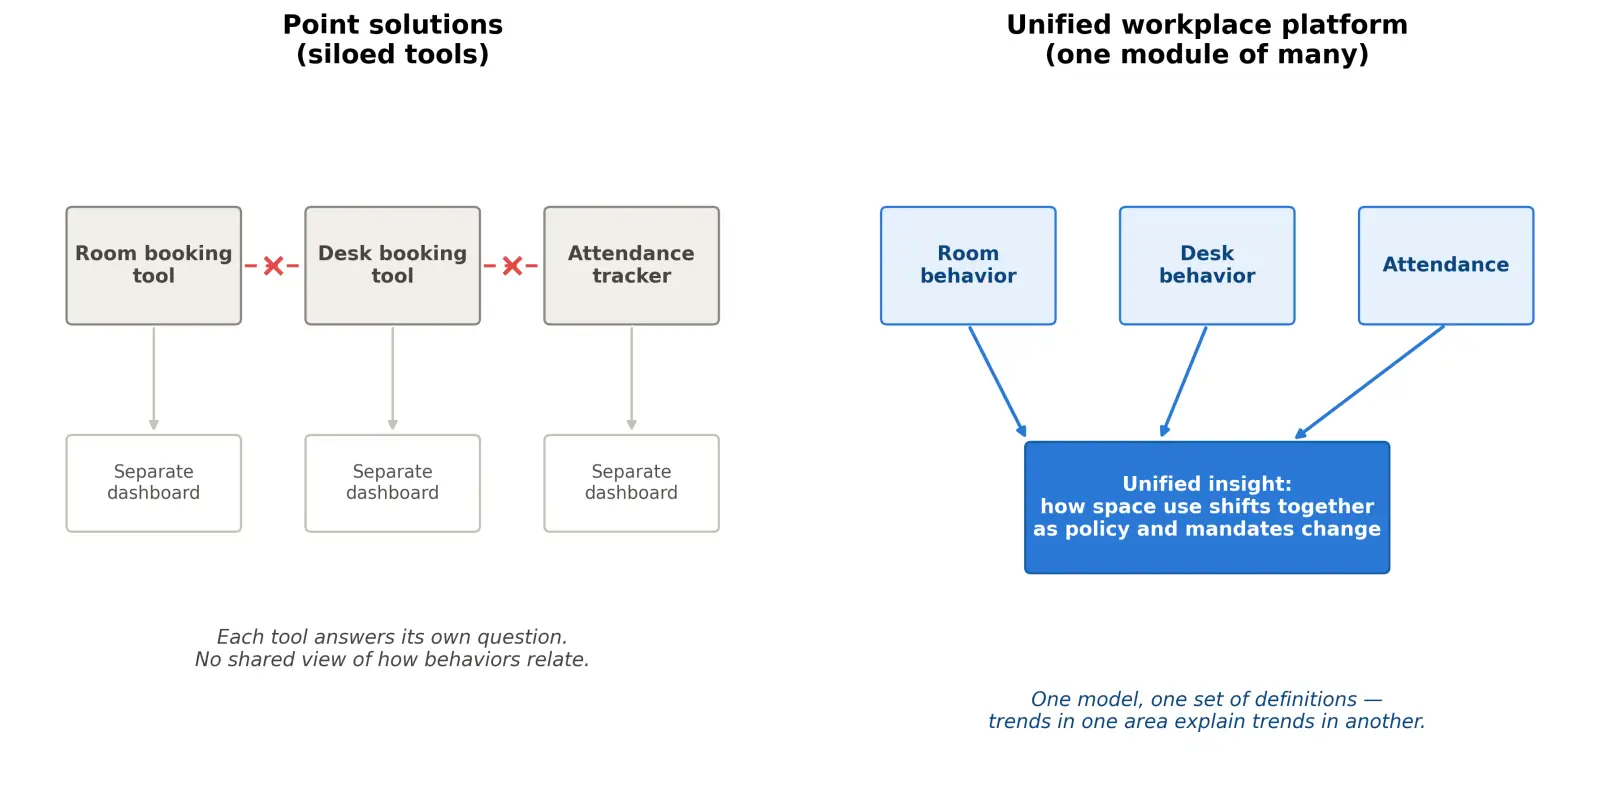
Most meeting room analytics conversations treat the room as an isolated unit - a sensor on a door, a calendar feed, a utilization percentage. That view misses a connection that only shows up when room data sits inside a broader workplace platform alongside desk booking and overall attendance data.
The 2026 attendance surge - the jump from 36% to 55% of employees attending three to four days a week in a single year - didn’t land evenly across every team or every day. It concentrated in some departments, some days, and some buildings more than others. A meeting room analytics feed in isolation will show that a room’s utilization went up; it won’t show why, or whether the same surge is straining desk availability on the same days, or whether teams with better access to the right room types are the ones driving higher in-office attendance in the first place. Those are questions that require room data, desk data, and attendance data to sit in one place rather than three separate dashboards that nobody reconciles.
This is the practical case for treating meeting room analytics as one module of a workplace management platform rather than a standalone point solution: the value isn’t just in measuring the room, it’s in seeing how room behavior, desk behavior, and attendance move together as hybrid policies and office mandates keep shifting.
4 Best Meeting Room Analytics Software: A Quick Comparison
The four tools below were chosen using one main filter: does the analytics layer connect room data to desk and attendance data, or does it report on rooms in isolation? Platforms that treat room analytics as a standalone module - however polished - didn’t make the cut, since they can’t answer the portfolio-level question hybrid policies now demand.
Beyond that main filter, we compared the four on a few practical dimensions: what the dashboard actually shows (utilization rates, peak/off-peak patterns, no-show and ghost meeting rates), how far back and how granular the data goes, whether AI-based recommendations are available, how analytics ties into floor plans and space planning, and what it takes to get accurate data in the first place (sensors required versus booking-data-only). Pricing and setup effort round out the comparison, since a tool that needs a hardware rollout solves a different problem than one that works off existing booking data.
1. YAROOMS
Yes, YAROOMS is on this list for a straightforward reason: this kind of cross-functional analytics has been part of the platform since day one, not a feature bolted on later, and we’d put our reporting up against anyone’s as one of the stronger sets of workplace data available on the market.
On the specific dimensions:
- Dashboard depth: room utilization, no-show rates, and booking counts, plus heat maps that show where employees gather or avoid, which extend the room view spatially rather than just numerically.
- Cross-functional data: this is where YAROOMS stands out. The same platform reports on hybrid work compliance, service utilization (catering, equipment, cleaning), and visitor analytics using the same underlying booking data, so a room utilization trend can be checked against attendance or desk patterns without switching tools.
- AI layer: handled by Yarvis, YAROOMS’ AI agent, rather than the analytics dashboard itself. Yarvis helps employees book the right room directly (matching capacity and requirements instead of defaulting to whatever’s free), remembers individual booking preferences over time, and surfaces the best-fit spot for a given meeting. It’s a practical front-end to the room-sizing problem rather than a separate analytics feature.
- Floor plan / space planning tie-in: heat maps function as the spatial layer, letting utilization data be viewed as occupied versus underused zones rather than just a list of bookings.
- Data collection: analytics run off booking and check-in data rather than requiring a sensor rollout.
- Setup/pricing: analytics is available starting on the Business plan, from $399/month.
2. Robin
Robin’s analytics center on pulling many data sources together: the platform unlocks occupancy, space utilization, and behavior insights with the help of artificial intelligence, all within a single platform for workplace leaders. Meeting rooms are read alongside desks, presence, and collaboration data rather than scored alone.
- Dashboard depth: shows which buildings, floors, spaces, desks and other resources are used most, when and by whom.
- Cross-functional data: tracks workplace presence across multiple data sources and measures collaboration by looking at planned meetings, desk proximity and occupancy trends together.
- AI layer: an AI Agent for Analytics plus AI in resource booking. Robin also claims it can predict future workplace trends, like expected real estate usage or spaces you could live without.
- Floor plan / space planning tie-in: historical data is used to justify office layout changes, moves, expansions, and desk assignments.
- Data collection: draws from calendar systems, communication tools, access control systems, occupancy sensors, and HR systems, plus API for more - so accuracy relies on multiple connected sources, not just booking data.
- Setup/pricing: quote-only.
3. Archie
Archie’s pitch is real-time visibility: get clear insights into occupancy, desk and room usage, peak hours, and no-shows, all in real time, with the Insights Hub built to help teams spot trends, plan space, and get more out of their office.
- Dashboard depth: covers office presence rate, daily office attendance, attendance rate by team, attendance rate by employee, real-time who’s on site, and check-in & check-out tracking.
- Cross-functional data: desk, room, and floor data sit together - Archie lets teams track bookings and usage across desks, rooms, and floors to spot what’s popular, what’s empty, and what might be overbooked, and separately looks at booking patterns to understand how and when teams work together in person.
- AI layer: AI features don’t appear to be part of Archie’s analytics offering.
- Floor plan / space planning tie-in: includes capacity planning to track how full the office gets and spot when it’s time to scale up or down, plus space setup to assign desks and plan seating by team or floor.
- Data collection: relies on verified check-ins rather than passive sensors - geo-verified check-ins, QR code check-in at desks, door access integration to auto-log check-ins/check-outs, and visitor registration via kiosk or QR code.
- Setup/pricing: occupancy analytics is included with the Room Booking Starter plan, $8/room/month (min. $159/month). Some of the more advanced features - filtering analytics by department and team, auto-send reports, and capacity-based alerts - are locked behind higher pricing tiers.
4. Kadence
Kadence’s angle is connecting analytics to action: Kadence workplace analytics gives you the specific data you need to understand space booking, resource allocation, and utilization, with room data feeding directly into broader space-planning decisions rather than sitting in its own silo.
- Dashboard depth: tracks occupancy trends, check-in rates vs. bookings, and underused areas across offices, plus peak office trends to monitor peak days and prevent overcrowding.
- Cross-functional data: attendance and collaboration sit alongside space data. Kadence automates attendance tracking across all locations with granular reporting by team, department, or location, compares in-office attendance across teams against expected presence, and separately tracks meeting frequency and booking overlaps, plus which departments collaborate most on-site. A consolidated view called Insights Plus brings all data into a single, comprehensive view across all locations as one source of truth.
- AI layer: this is Kadence’s strongest differentiator versus the others reviewed. Its SpaceOps module is an AI-first software that serves as a command center unifying scenario planning, stack planning, and move management. Specifically, it can instantly generate multiple “what-if” scenarios, from headcount growth to policy shifts, and evaluate impacts on space, costs, and team productivity before committing, and supports automating move planning and allocations with AI-powered workflows. Kadence also has a separate AI Agent for booking suggestions, sitting outside the analytics module itself.
- Floor plan / space planning tie-in: includes stack planning to visualize space allocation by department and drag-and-drop teams and layouts to test various configurations.
- Data collection: relies on booking and check-in data rather than sensors, with an auto-release feature that frees up no-show bookings back into the system to reduce wasted space.
- Setup/pricing: Kadence splits its product into two tiers - WorkOps (includes workplace analytics) and SpaceOps (includes scenario planning, occupancy modeling). No public pricing is listed - a custom quote is required.
| YAROOMS | Robin | Archie | Kadence | |
|---|---|---|---|---|
| Dashboard | Room utilization, no-shows, bookings, heat maps | Usage by space/desk, by whom | Presence & attendance by team/employee, real-time | Occupancy, check-in vs. bookings, peak days |
| Cross-functional data | Rooms + desks + hybrid compliance + services + visitors | Rooms + desks + presence + collaboration | Rooms + desks + floors, collaboration patterns | Rooms + attendance + collaboration (Insights Plus) |
| AI layer | Yarvis: best-fit room, remembers preferences (not in analytics) | AI Agent for Analytics + predictive trends | Not available | SpaceOps: AI scenario & move planning |
| Floor plan tie-in | Heat maps (occupied vs. underused) | Layout/move decisions from history | Capacity & seat planning | Interactive floor plans, stack planning |
| Data collection | Booking/check-in, no sensors | Multi-source: calendars, access control, sensors, HR, API | Geo-verified check-ins, QR, door access | Booking/check-in, auto-release no-shows |
| Pricing | From $399/mo (Business plan) | Quote-only | From $8/room/mo (min. $159/mo) | Quote-only |
Where Meeting Room Analytics Are Headed
Two AI capabilities are changing what room analytics can do. Predictive demand forecasting uses past booking patterns and organizational calendars to flag which rooms and time slots will get crowded before the conflict happens, not after. AI-assisted room recommendations work the same data harder: instead of employees defaulting to the first large room on the list, the system matches room to meeting based on headcount, equipment, and duration. This works better now than it did a few years ago, simply because most meetings involve six people or fewer and that pattern is finally being tracked consistently enough to act on.
The bigger shift is contextual: as companies reinstate firm in-office requirements, “is this room used efficiently” stops being the right question. The real question is whether total space - rooms, desks, everything between - can absorb an office that’s filling back up. That’s a portfolio question, and answering it means connecting room data to desk and attendance data rather than analyzing rooms in isolation.
FAQ: Meeting Room Analytics
The questions below come up most often once teams start looking at their own room data.
What’s the Difference Between Meeting Room Utilization and Occupancy?
Utilization measures how often a room is booked and used relative to its total available hours. Occupancy measures how many people actually use the room relative to its capacity. A room can have high utilization (booked most of the day) and still have poor occupancy (a handful of people in a room built for twelve) - which means the fix isn’t fewer bookings, it’s a smaller room.
What’s a Good Meeting Room Utilization Rate?
Most sources point to a target range of roughly 40-60% of core business hours. Below that range usually means more meeting room capacity than the organization needs; above it usually means employees are running into booking conflicts and limited availability. The right number for your office depends on your room mix and how much collaboration happens in person.
How Do Meeting Room Analytics Help With Hybrid Work?
They show which rooms genuinely support hybrid collaboration - by tracking video conferencing equipment usage, identifying which days bring remote employees into the office, and revealing whether rooms are set up to handle both in-person and remote participants well. With global office attendance rising again, that visibility matters more than it did when offices were running well below capacity.
How Can Organizations Reduce Meeting Room No-Shows?
The most direct levers are automatic check-in requirements, auto-release policies that free a room if no one checks in within 10-15 minutes, and reminder notifications sent before the meeting starts. Sharing utilization data with teams that have high no-show rates also tends to shift booking behavior on its own, simply by making the pattern visible.
Do Meeting Room Analytics Require Physical Sensors?
No, requirements vary by platform. Some solutions (for example, YAROOMS, Robin, Archie, Kadence) work entirely from booking data and calendar integrations, which gives directional insight at no hardware cost. More precise tracking, particularly for occupancy-versus-capacity questions, requires sensors, badge data, or check-in systems to confirm what’s actually happening in the room versus what’s on the calendar.
Are Most Meeting Rooms Actually Oversized for How Teams Meet Today?
Often, yes. Recent analysis of over a million real meetings found that 64% involve six or fewer participants and only 8% exceed ten people, with a median duration of 35 minutes. A room inventory built around 10-12 person boardrooms, which is still the default in many offices, doesn’t match that pattern for most of the working day.
Workplace of the future. Today.
See how YAROOMS integrates with Microsoft 365 to create a seamless workspace booking experience.