Office Heat Maps: Optimize Your Workspace!
Welcome to the fascinating world of office heat maps! An innovative approach to workspace optimization, these visual tools can help you transform your workplace into a hub of productivity, efficiency, and creativity. If you’ve ever wanted to learn more about those smart color-coded diagrams representing movement and occupancy within an office space, this article is your starting point.
TL;DR:
- Office Heat Maps Defined: Visual tools that use colors to show different levels of activity or occupancy in office spaces, helping optimize the workplace.
- How They Work: By collecting data from sensors, Wi-Fi, and booking systems, heat maps track people’s movement and space usage, offering insights into actual vs. planned occupancy.
- Data Insights: Heat maps reveal activity levels, usage frequency, and social dynamics within the office, aiding space management and fostering collaboration.
- Key Features: Include accurate floor plans, color coding for activity levels, filters, interactive elements, and analytics for detailed space utilization analysis.
- Benefits: Enhance office layout and design, optimize productivity, address occupancy issues, and gauge employee engagement and satisfaction.
- Best Practices: Involve regular data updating employee participation and use heat maps as a management communication tool to ensure effectiveness.
- Future Potential: Advancements like machine learning, AI, and AR could further enhance the utility of office heat maps, promising even more dynamic workplace optimization.
First Things First: What Are Office Heat Maps?
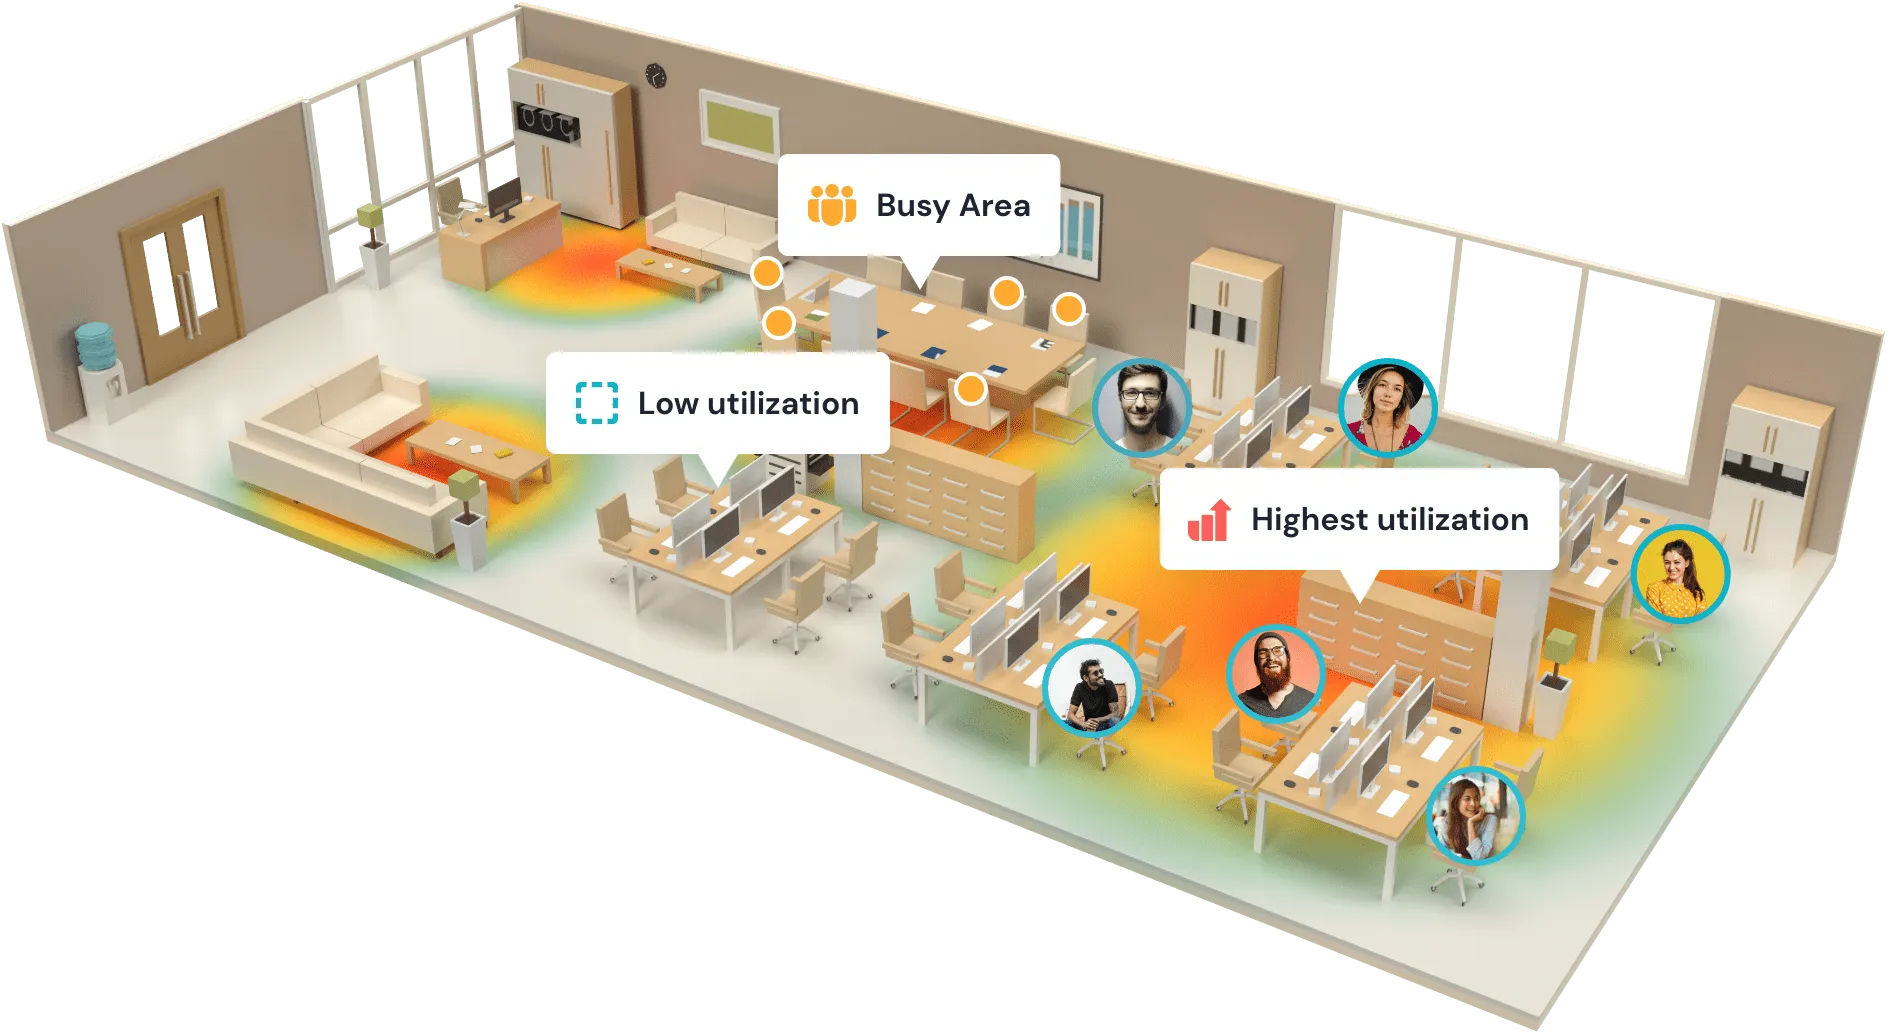
Office heat maps are visual tools used to represent data about the usage and occupancy of office spaces. They use colors to illustrate varying activity levels or occupancy across different areas within an office environment. Typically, warmer colors (such as reds and oranges) indicate high usage or occupancy rates, while cooler colors (like blues and greens) signify lower usage.
These maps can be generated through various means, including sensor data from IoT devices, Wi-Fi tracking, or space booking software. Office heat maps are invaluable for facility managers and corporate planners, providing insights into space utilization , identifying overcrowded or underused areas, and helping to make informed decisions about office layouts , space optimization, and workplace strategies to enhance efficiency and employee satisfaction.
How Office Heat Maps Work
Office heat maps work by collecting and analyzing data on the presence and movement of people within an office space, as well as from desk booking and room reservation systems. These technologies and systems track the flow and density of employees in different parts of the office, recording when and where desks and rooms are booked and providing a comprehensive view of actual versus planned usage. The collected data is then processed and visualized on a map of the office layout , with colors representing different activity levels—ranging from high (warm colors) to low (cool colors). This visual representation allows managers and planners to easily interpret patterns of space usage, such as which areas are most frequently occupied or which conference rooms are rarely used, against the backdrop of booked versus actual occupancy.
By analyzing these patterns, organizations can optimize their office layouts for better efficiency, enhance employee experience by addressing space needs, and make data-driven decisions regarding real estate and facilities management, ensuring resources are used optimally.
Different Types Of Data Represented In Office Heat Maps
Office heat maps are powerful tools that offer much more than just a glimpse into which office areas are busy or empty. They capture various data types, making them invaluable for understanding how an office space functions. Here’s a breakdown of the different kinds of information you can get from office heat maps:
- Activity Levels and Occupancy Rates: At their core, heat maps show how full or empty different office parts are throughout the day. This helps identify which areas are constantly in use and which are not, guiding decisions on space management.
- Usage Frequency: By looking at the heat maps, you can easily see which desks, meeting rooms, or collaboration spaces are the most popular. This shows you what areas are preferred for work or meetings, helping you better plan and allocate resources.
- Social Dynamics: Another fascinating aspect is the insight into social interactions within the workplace. Heat maps can show who likes to work close to whom or where collaborative work happens most often. This can help foster teamwork and productivity by arranging spaces that enhance collaboration.
In essence, office heat maps are not just about tracking where people are; they’re about understanding how an office breathes and lives. They offer a treasure trove of data beyond simple location tracking, providing strategic insights into operations, employee behavior, and office dynamics. This information is ready for interpretation and can be used to make informed decisions that improve the work environment for everyone.
Common Features And Elements Found In Office Heat Maps
By harnessing these features, office heat maps provide a wealth of information at your fingertips:
- Accurate Floor Plan Layout: The base of any office heat map is a detailed layout of your office’s floor plan . This ensures that you can easily match the data you see with the physical spaces in your office.
- Color Coding: Heat maps use a range of colors to show different levels of activity or occupancy. Typically, warm colors like red and orange highlight areas with high activity, while cool colors like blue and green indicate lower usage.
- Filters & Time Sliders: These tools allow you to sift through the data based on specific criteria or time frames. Want to see which areas were busiest last Monday? Or which meeting rooms are used most in the afternoons? Filters and time sliders make it possible.
- Interactive Features: Many heat maps include interactive options such as zooming in for a closer look or clicking on specific areas for more detailed information. This can reveal insights like the exact number of people using a space or the peak times for a particular room.
- Granular Analytics: Beyond just showing hot and cold spots, some heat maps offer deeper workplace analytics . You might be able to see patterns over time, compare usage rates between different days or weeks, or even get predictive insights about future office space needs.
Benefits of Office Heat Maps
One question you might have at this point is why should my company use office heat maps? Simply put, these innovative tools offer many benefits that can significantly transform how your workspace functions and how your employees feel about their working environment.
Improving Office Layout and Design
By analyzing office heat maps, you can identify areas that receive little foot traffic or are not being used to their full potential.
These maps offer a colorful way to see how employees move around in an office, providing a valuable tool for improving how space is used. This information can help fix problems by changing layouts to eliminate overcrowded spots or make better use of spaces that aren’t being used much.
When it comes to placing furniture or deciding where communal areas should go, there’s nothing as helpful as accurate data on how the space is used. Heat maps allow those in charge to tailor workspaces to fit real-life patterns of movement, allowing for a more flexible and efficient office environment based on facts, not just guesses.
Optimizing Workspace Productivity and Efficiency
Office heat maps go beyond just illuminating physical layouts; they also shed light on more abstract concepts like productivity patterns across different departments, teams, or individual employees. By capturing detailed behavioral data – such as which areas are most active during specific times or which meeting rooms see heavy usage– companies can adapt their workplace design to promote optimal work conditions and boost overall productivity.
A well-designed workspace minimizes distractions, encourages collaboration, fosters creativity, and ensures employee satisfaction–all of which enhance productivity. The intelligence gleaned from heat mapping allows managers to streamline existing processes and create new strategies explicitly tailored to their workforce’s habits and preferences.

Identifying and Addressing Occupancy Issues
Monitoring occupancy in real-time represents another benefit of utilizing office heat maps. With many offices adopting hybrid working arrangements , understanding how your space is occupied is vital to ensure the workspace remains adaptable to shifting use patterns.
Office heat maps can reveal whether space utilization leans towards underutilization or overcrowding at different times. These insights can be instrumental in adjusting office policies, like promoting hot desking during peak occupancy periods or addressing underused areas that drain resources unnecessarily.
Measuring Employee Engagement and Satisfaction Levels
The subtler advantage of office heat maps is their ability to offer objective insights into employee engagement and satisfaction levels. For instance, a disproportionately high level of activity around breakout rooms or recreational zones could indicate staff members seek more stress relief outlets during work hours – pointing toward potential burnout issues. On the other hand, an abundance of movement around collaborative spaces may indicate high team collaboration rates.
Employers receive valuable feedback for improving operational efficiencies and enhancing workers’ well-being by gauging employees’ physical interaction with the workspace. Ultimately, a happy workforce translates to a productive workforce, making office heat mapping indispensable for today’s workplace.
YAROOMS Workplace Analytics: Office Heat Maps
Workplace analytics is a crucial part of the comprehensive YAROOMS Workplace Experience Platform , using innovative technology to see how office spaces are utilized. The system looks closely at desk and room booking data and turns it into easy-to-understand heat maps. These maps show which parts of the office are most and least used, helping facility and operations managers make smart changes to their space and resources.
This strategic insight helps enhance operational efficiency, improve employee satisfaction by tailoring spaces to their needs, and, ultimately, optimize the overall workplace environment for productivity and collaboration.
Best Practices for Using Office Heat Maps
Whether you’re looking to redesign your office space or improve your team’s interaction, understanding how to leverage office heat maps effectively is crucial.
Regularly Updating and Maintaining Office Heat Map Data
Generating accurate office heat maps requires consistent effort. Rather than being a one-time process, it’s a practice that should be continually performed. Since employee behavior, occupancy rates, and workspace usage patterns are often subject to change, regularly updating and maintaining your office heat map data ensures the captured information remains relevant.
Firstly, it’s critical to establish a regular schedule for gathering data. This can be on a weekly or monthly basis, depending on the dynamics of your workspace. Secondly, ensure the gathered data undergoes proper cleaning before use since inaccurate data can lead to misleading insights. Lastly, guarantee your heat map tools stay up-to-date with recent upgrades and extensions, providing higher reading accuracy.
Involving Employees in The Process of Creating and Using Office Heat Maps
Employees play an integral part in creating effective office heat maps because they know their work habits better than anyone else. Their input is valuable in producing pragmatic results.
Encourage employees to use desk and room booking software to keep track of their seating details; this enhances the precision of occupancy information. Moreover, if employees have suggestions about improving workplace setup based on their everyday experiences, welcome such feedback with open arms. After all, these suggestions might turn out fruitful for both individual performance and overall company productivity.
Expert tip: consider conducting periodic workshops or training sessions to educate employees about the benefits of using office heat maps and how to interpret findings effectively.
Using Office Heat Maps as A Communication Tool For Management And Employees
Office heat maps are an exceptional communication tool for bridging gaps between management decisions and employee understanding of workplace issues.
By visually representing occupancy patterns and space utilization trends within the organization, everyone gets a clear picture of what’s happening across workspaces without detailed explanations or statistical figures.
Moreover, sharing updated heat maps regularly can promote transparency and trust within the organization. After all, it’s a way of showing your workforce that their work habits are being considered to cultivate a more efficient workspace. Remember, effective utilization of office heat maps starts with transparent communication between all involved parties.
Pitfalls to Avoid When Using Office Heat Maps
Let’s look at common pitfalls you should avoid when using office heat maps. While these visual data tools can provide incredible insights into workspace utilization and employee productivity, it’s essential not to overlook potential drawbacks that could hinder data interpretation.
Relying Solely on Office Heat Map Data Without Considering Other Factors
The first setback often arises when organizations depend entirely on their office heat map data without considering other relevant factors. While office heat maps effectively reveal complex data about your workspace usage, they don’t always supply the complete picture.
For instance, if your office heat map shows an area as heavily used, you might quickly decide that this area is a hotbed of productivity. However, there may be other reasons for its high traffic that the map doesn’t reveal directly. Perhaps it’s simply near a popular coffee machine or restroom! This suggests an apparent reality: To make balanced decisions about your workspace layout and design, you must combine office heat maps with direct observation and employee feedback.
In addition, economic factors such as operational costs or technological constraints can significantly affect how servers categorize spaces within an organization. These external influences are incompletely displayed on a generated heat map but could considerably impact your optimization strategies.

Bias in Data Collection or Interpretation Affecting The Accuracy of Office Heat Maps
Another potential pitfall involves bias in collecting or interpreting data for the heat maps. Bias could stem from insufficient sampling – e.g., if your data primarily originates from peak employees’ usage periods and excludes slower times, which might show different patterns.
Similarly, human interpretation of the generated office heat map also runs the risk of biased judgment; what one person perceives as an underutilized space might be an essential decompress zone for another person, requiring minimal noise and interaction!
So, how do we tackle these biases? One way is to utilize objective utilization metrics in the evaluation phase and ensure data collection covers a thorough cross-section of times and days. Moreover, involving multiple stakeholders in the interpretation process can help balance diverse perspectives and reduce individual bias. In this way, office heat maps become a more holistic tool for enhancing workplace efficiency.
Remember, completeness in your observations will aid you immensely as you strive to attain an optimum workspace. With cautious application, office heat maps can be an invaluable ally along your journey toward increased productivity and employee satisfaction!
The Future of Office Heat Maps
As we step forward, office heat maps continue to evolve rapidly. It’s fascinating to delve into their potential. Let’s analyze the upcoming technologies and advancements related to office heat maps.
Emerging Technologies and Advancements in Office Heat Map Analysis
The advent of emerging technologies provides promising new vantage points for understanding workspaces better by harnessing data from office heat maps.
Consider machine learning algorithms, for example; these powerful tools can automatically identify patterns and draw insights from data that would be nearly impossible for humans to compute manually. They sift through large amounts of office heat map data, turning it into actionable knowledge that managers or business owners can use.
Artificial Intelligence is another technology impacting how we understand workspace dynamics through office heat maps. AI platforms could predict future occupancy trends based on past behavior patterns, offering stakeholders robust predictive tools.
On a more tangible level, augmented reality (AR) also has significant potential when combined with office heat maps. Imagine seeing your office layout overlaid with real-time data right before your eyes. This technology could physically represent people flow, areas of high engagement, or underutilization - painting an innovative panorama of our workplaces.
Combine all this with the ongoing improvements in the accuracy and reliability of such analysis techniques—and the future indeed looks bright for office heat map technology.
Potential Applications and Benefits of Office Heat Maps in the Future
Imagine a future where technology understands our current needs and unlocks a world of possibilities for innovative companies willing to explore. Here’s a glimpse into what could be:
- Boosting Health and Wellness: Think of an office heat map as a health advisor, revealing how simple changes in movement or sunlight exposure can significantly improve employee well-being by boosting cardio health and Vitamin D levels.
- Eco-friendly Workspaces: By linking office heat map data with building management systems, we can predict and adjust heating, cooling, and lighting needs, leading to greener, more efficient offices based on actual occupancy patterns.
- Enhanced Safety Plans: In emergencies like fires or earthquakes, understanding how people move around can lead to better evacuation strategies, potentially saving lives by leveraging detailed movement data.
At its core, the evolution of office heat maps represents a shift towards more human-centric workspace design, focusing on wellness and productivity by aligning spaces with natural human behavior and preferences. This heralds a new age of workplace innovation.

Summing It Up
Office heat maps, with their vibrant visual representations of critical data, pave the way for revolutionary changes in optimizing workspaces. Imagine the impact of reshaping your office layout to boost productivity or using this data to gauge how happy and satisfied employees are with their work environment. The potential benefits are both thrilling and vast.
However, as with any technology, its success hinges on our understanding and application. Gathering accurate data and selecting tools that align with our specific needs is crucial. As technology evolves, promising an even brighter future for office heat maps, we must remain vigilant against biases and the pitfalls of relying too heavily on just one type of data.
Involving employees in this process is critical—they’re at the heart of these efforts to enhance their workspace experience. Using office heat maps can also streamline communication with management, providing a solid basis for making necessary changes and moving away from guesswork to evidence-based strategies.
As we delve into the latest advancements in this area, one thing stands out: office heat maps are set to play a pivotal role in shaping work environments that boost productivity and enrich employee satisfaction. Here’s looking forward to a future where understanding and improving office dynamics is easier and grounded in reliable, actionable data.
Workplace of the future. Today.
See how YAROOMS integrates with Microsoft 365 to create a seamless workspace booking experience.