Workplace analytics for data-driven decisions
Arm yourself with sharp workplace analytics and create optimized office spaces that work for your employees.
Trusted by innovative organizations worldwide

Comprehensive workplace insights
Understand how your office space is used and what makes your employees satisfied
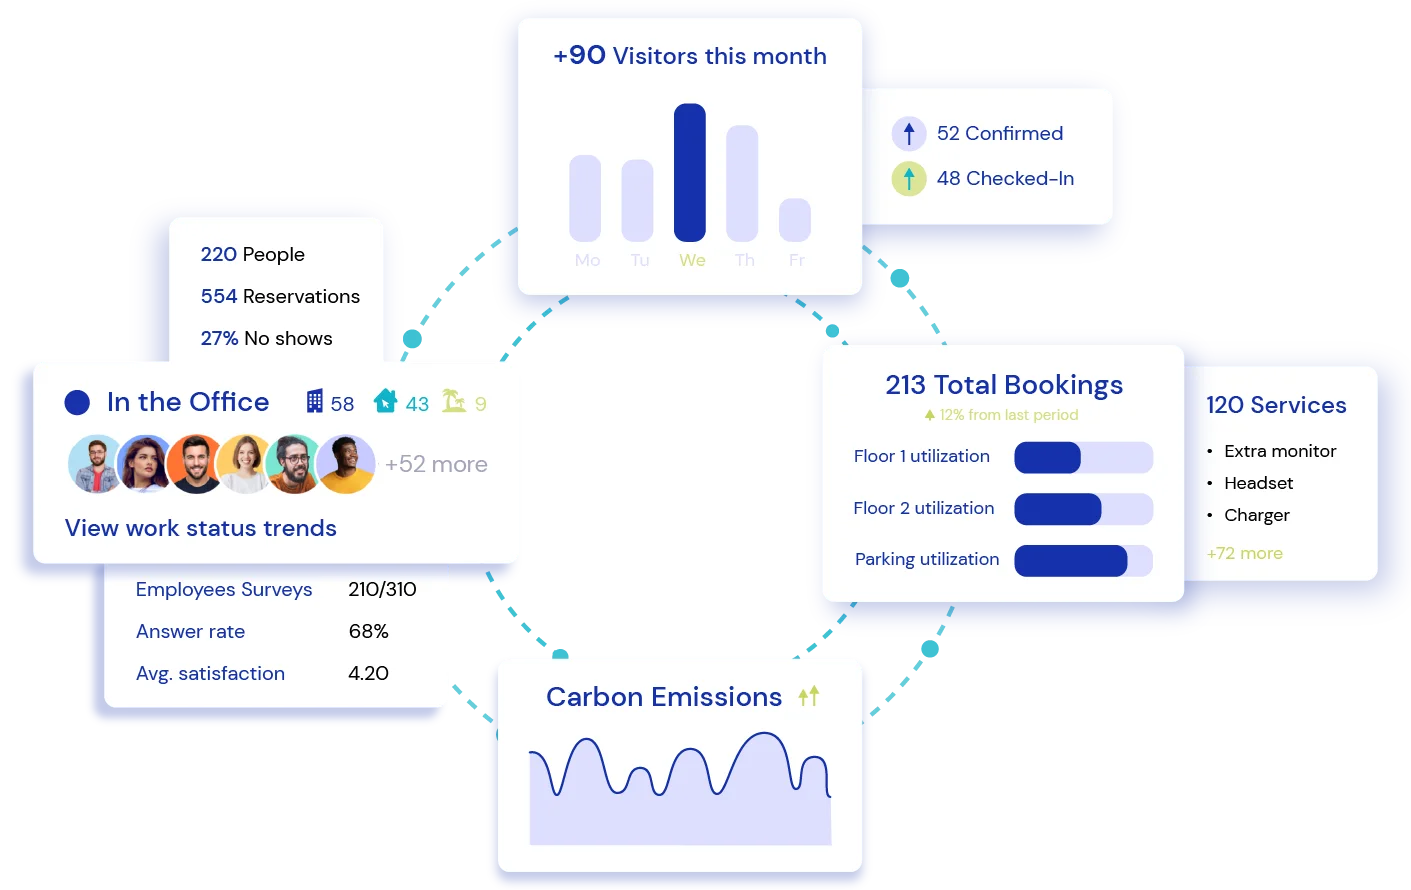
Office Utilization Analytics
Insights into average office space usage, no-show rates, and booking counts. Heat maps identify where employees gather or avoid.
Hybrid Work Analytics
Track time employees spend in-office versus remote. Compare trends across teams and departments to inform workplace policies.
Service Utilization Analytics
Monitor bookable office services like catering, equipment, and cleaning. Break down data by service type and location.
Visitor Analytics
Dashboard showing visitor traffic, host details, visit types, and check-in statuses with comprehensive reports.
Employee Satisfaction Analytics
Survey-based reports measuring workplace experience and happiness. Compare satisfaction across individuals, groups, and locations.
Office Heat Maps
Visual representation of space utilization patterns. Identify popular areas and underutilized zones.
Key Benefits


Workplace analytics: FAQ
Answering the most common questions about workplace analytics and how it helps business leaders make data-driven decisions.
To access workplace analytics, organizations typically implement an analytics solution that integrates various tools to track and measure key aspects of workplace performance. All-in-one workplace management platforms like YAROOMS provide embedded workplace and workforce analytics that allow businesses to monitor office space usage, employee satisfaction, and overall productivity.
Businesses can optimize their work environment and workforce operations using analytics tools. For example, YAROOMS provides actionable insights into how teams use office space and workplace occupancy data, helping organizations make data-driven decisions to improve employee experience and efficiency. These solutions can also highlight trends in employee behavior, allowing management to proactively address issues, enhance productivity, and optimize organizational processes.
The main benefit of workplace analytics is the ability to gain a comprehensive, data-driven understanding of how your office space and workforce operate. By leveraging workplace analytics and HR analytics, businesses can monitor workplace productivity, employee satisfaction, and collaboration through dashboards that visualize crucial metrics. Drawing from real-time and historical data, these insights enable organizations to make strategic decisions that optimize the workplace experience.
Workplace analytics software integrates data sources to offer actionable insights into space management, such as identifying opportunities for hybrid work models or sub-renting unused office space. This data-driven approach improves decision-making, enhances productivity, and helps create a more efficient and satisfying work environment for employees.
In the workplace, data is used in many ways to help improve productivity and employee engagement. Business leaders use workforce and HR analytics tools to measure employee performance, office space usage, and collaboration. Dashboards provide a clear view of critical metrics, allowing companies to track real-time progress and outcomes.
Organizations can identify trends, optimize strategies, and make informed decisions by analyzing data from different sources, such as historical data and employee surveys. This helps companies understand what’s working and where improvements are needed, ultimately boosting organizational performance and creating a more productive work environment. Data helps quantify results and guide business strategies for better outcomes.
To establish a data-driven culture in the workplace, start by aligning data usage with your overall business goals. This involves using analytics software to measure productivity, space management, and employee engagement. It’s essential to involve the entire organization so everyone’s data contributes to decision-making. Business leaders should foster collaboration and use data from various sources, such as workspace and meeting room usage, to drive outcomes.
Integrating descriptive, predictive, and prescriptive analytics will help measure progress, predict future trends, and provide recommendations for improving workplace performance . Regularly reassessing strategies based on data insights ensures ongoing alignment and proactive decision-making. Building this culture starts with people embracing the value of data in everyday decisions, ultimately leading to better organizational outcomes and more informed business decisions.
Related Products
Desk Booking
A top-rated desk management and booking solution that simplifies workspace reservations and brings …
Meeting Room Booking
A powerful yet easy-to-use meeting room booking system that simplifies scheduling and ensures no …
Hybrid Workplace
Seamlessly manage people and spaces in a flexible work environment with modern and user-friendly …