Jump to:
1. The map view
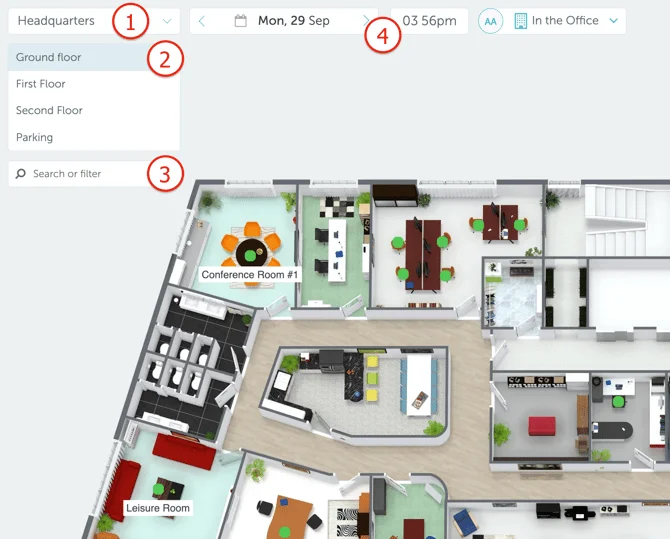
The map view (Workplace → Map) is an interactive map of one of your location’s floors. It can be used to:
- Check real-time or future space availability;
- Search for spaces, space features, or colleagues (read this article for more information);
- Book a space (read how to book a space in this article ).
2. How to navigate the map view
The map view can be easily navigated using the following controls:
Location selector (1) - allows you to access floor maps of different locations in your organisation (for example, New York office and Boston office).
Floor selector (2) - allows you to access maps of different floors in the selected location (for example, ground floor in the New York office)
Search or filter option (3) - allows you to search for spaces, space features, or colleagues and see the search results directly in the map (for more information, read this article ).
Date selector (4 left) - allows you to see the space availability in the future (different date).
REMOVED: Time selector (4 right) - allowed you to see the space availability at a certain time, on the selected day.
The Time Selector was removed on November 10th, 2025, and replaced with a more effective tool for viewing a space’s availability throughout the day - The Availability Bar .
For those who previously used this feature to check floor-wide availability at a specific time, please switch to the Timeline View , which provides a full overview of all spaces and their bookings across the day.
3. The Availability Bar
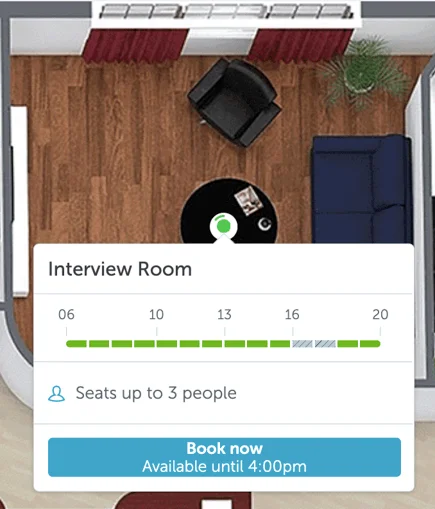
The new and improved way to check a space’s availability throughout the day—without leaving the Map View—is to simply click on the space and view its Availability Bar. You can also create a booking directly by clicking on any of the available (green) slots in that bar.
4. Available, busy, and disabled spaces
The map offers a visual, real-time view of all space statuses. To check a space’s availability throughout the day, simply click on it to see the time intervals when it’s available. For a broader overview of all spaces and their schedules, the Timeline View is also a great alternative.
Available spaces are marked in green. If you click on any available space on the map, you’ll see its availability throughout the day, along with its amenities, and you’ll be able to book it directly from there:
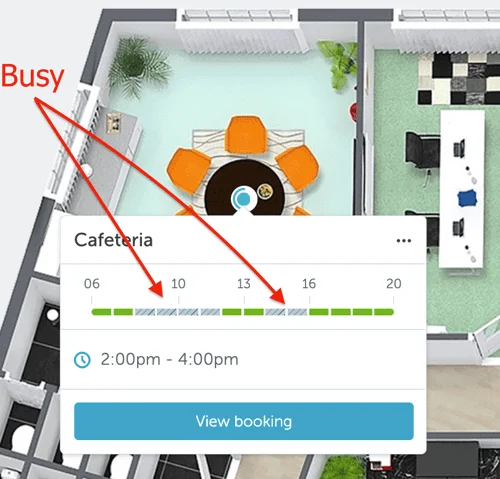
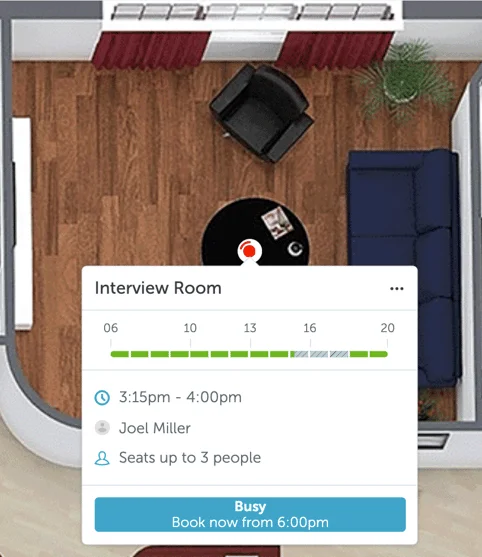
Busy spaces are marked in red. If you click on any busy space on the map, you’ll see its full-day availability, details about its amenities and who booked the space (if permitted by your organization’s visibility settings):
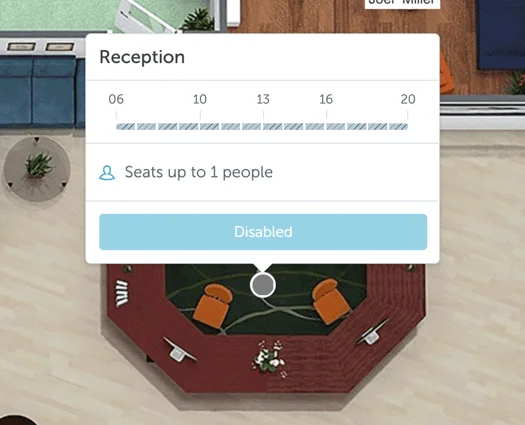
Disabled (not available for booking) spaces are marked in grey. If you press on any disabled space on the map, you will see information about its amenities and the “Unavailable” status:
5. Floor statistics: how to check real-time (or future) space availability
Each floor map contains the following statistics, allowing all users to get a real-time overview of:
- Percentage of permitted floor CAPACITY (Administrators can read how to adjust the floor capacity here );
- Percentage of floor OCCUPANCY;
- Number of available spaces;
- Number of busy spaces;
- Number of disabled (non-bookable) spaces.

6. Occupancy vs Capacity
Occupancy shows how much of the available schedule (in minutes) is booked at a location. If several spaces are booked, the occupancy percentage adds up all their booked time.
- Example: If a floor has only one space, and that space operates from 8 AM to 6 PM, a booking from 8 AM to 1 PM would result in 50% occupancy. If the same floor had 50 spaces, the same booking would represent only 1% occupancy, since the calculation accounts for the total booked time across all spaces.
Capacity, on the other hand, is shown only when a capacity value is defined at the location or floor level. It indicates the percentage of desks booked at a given time of day compared to the total available capacity.
- Example: If the capacity for a floor is set to 50 desks, and 5 desks are booked at a given time, the capacity percentage will be 10% (5 booked desks / 50 total capacity x 100).