Measure and improve office space utilization

YAROOMS space utilization analytics shows how desks, meeting rooms, parking and floors are actually used, built from booking and check-in data with no sensors.

Last updated: October 16, 2026

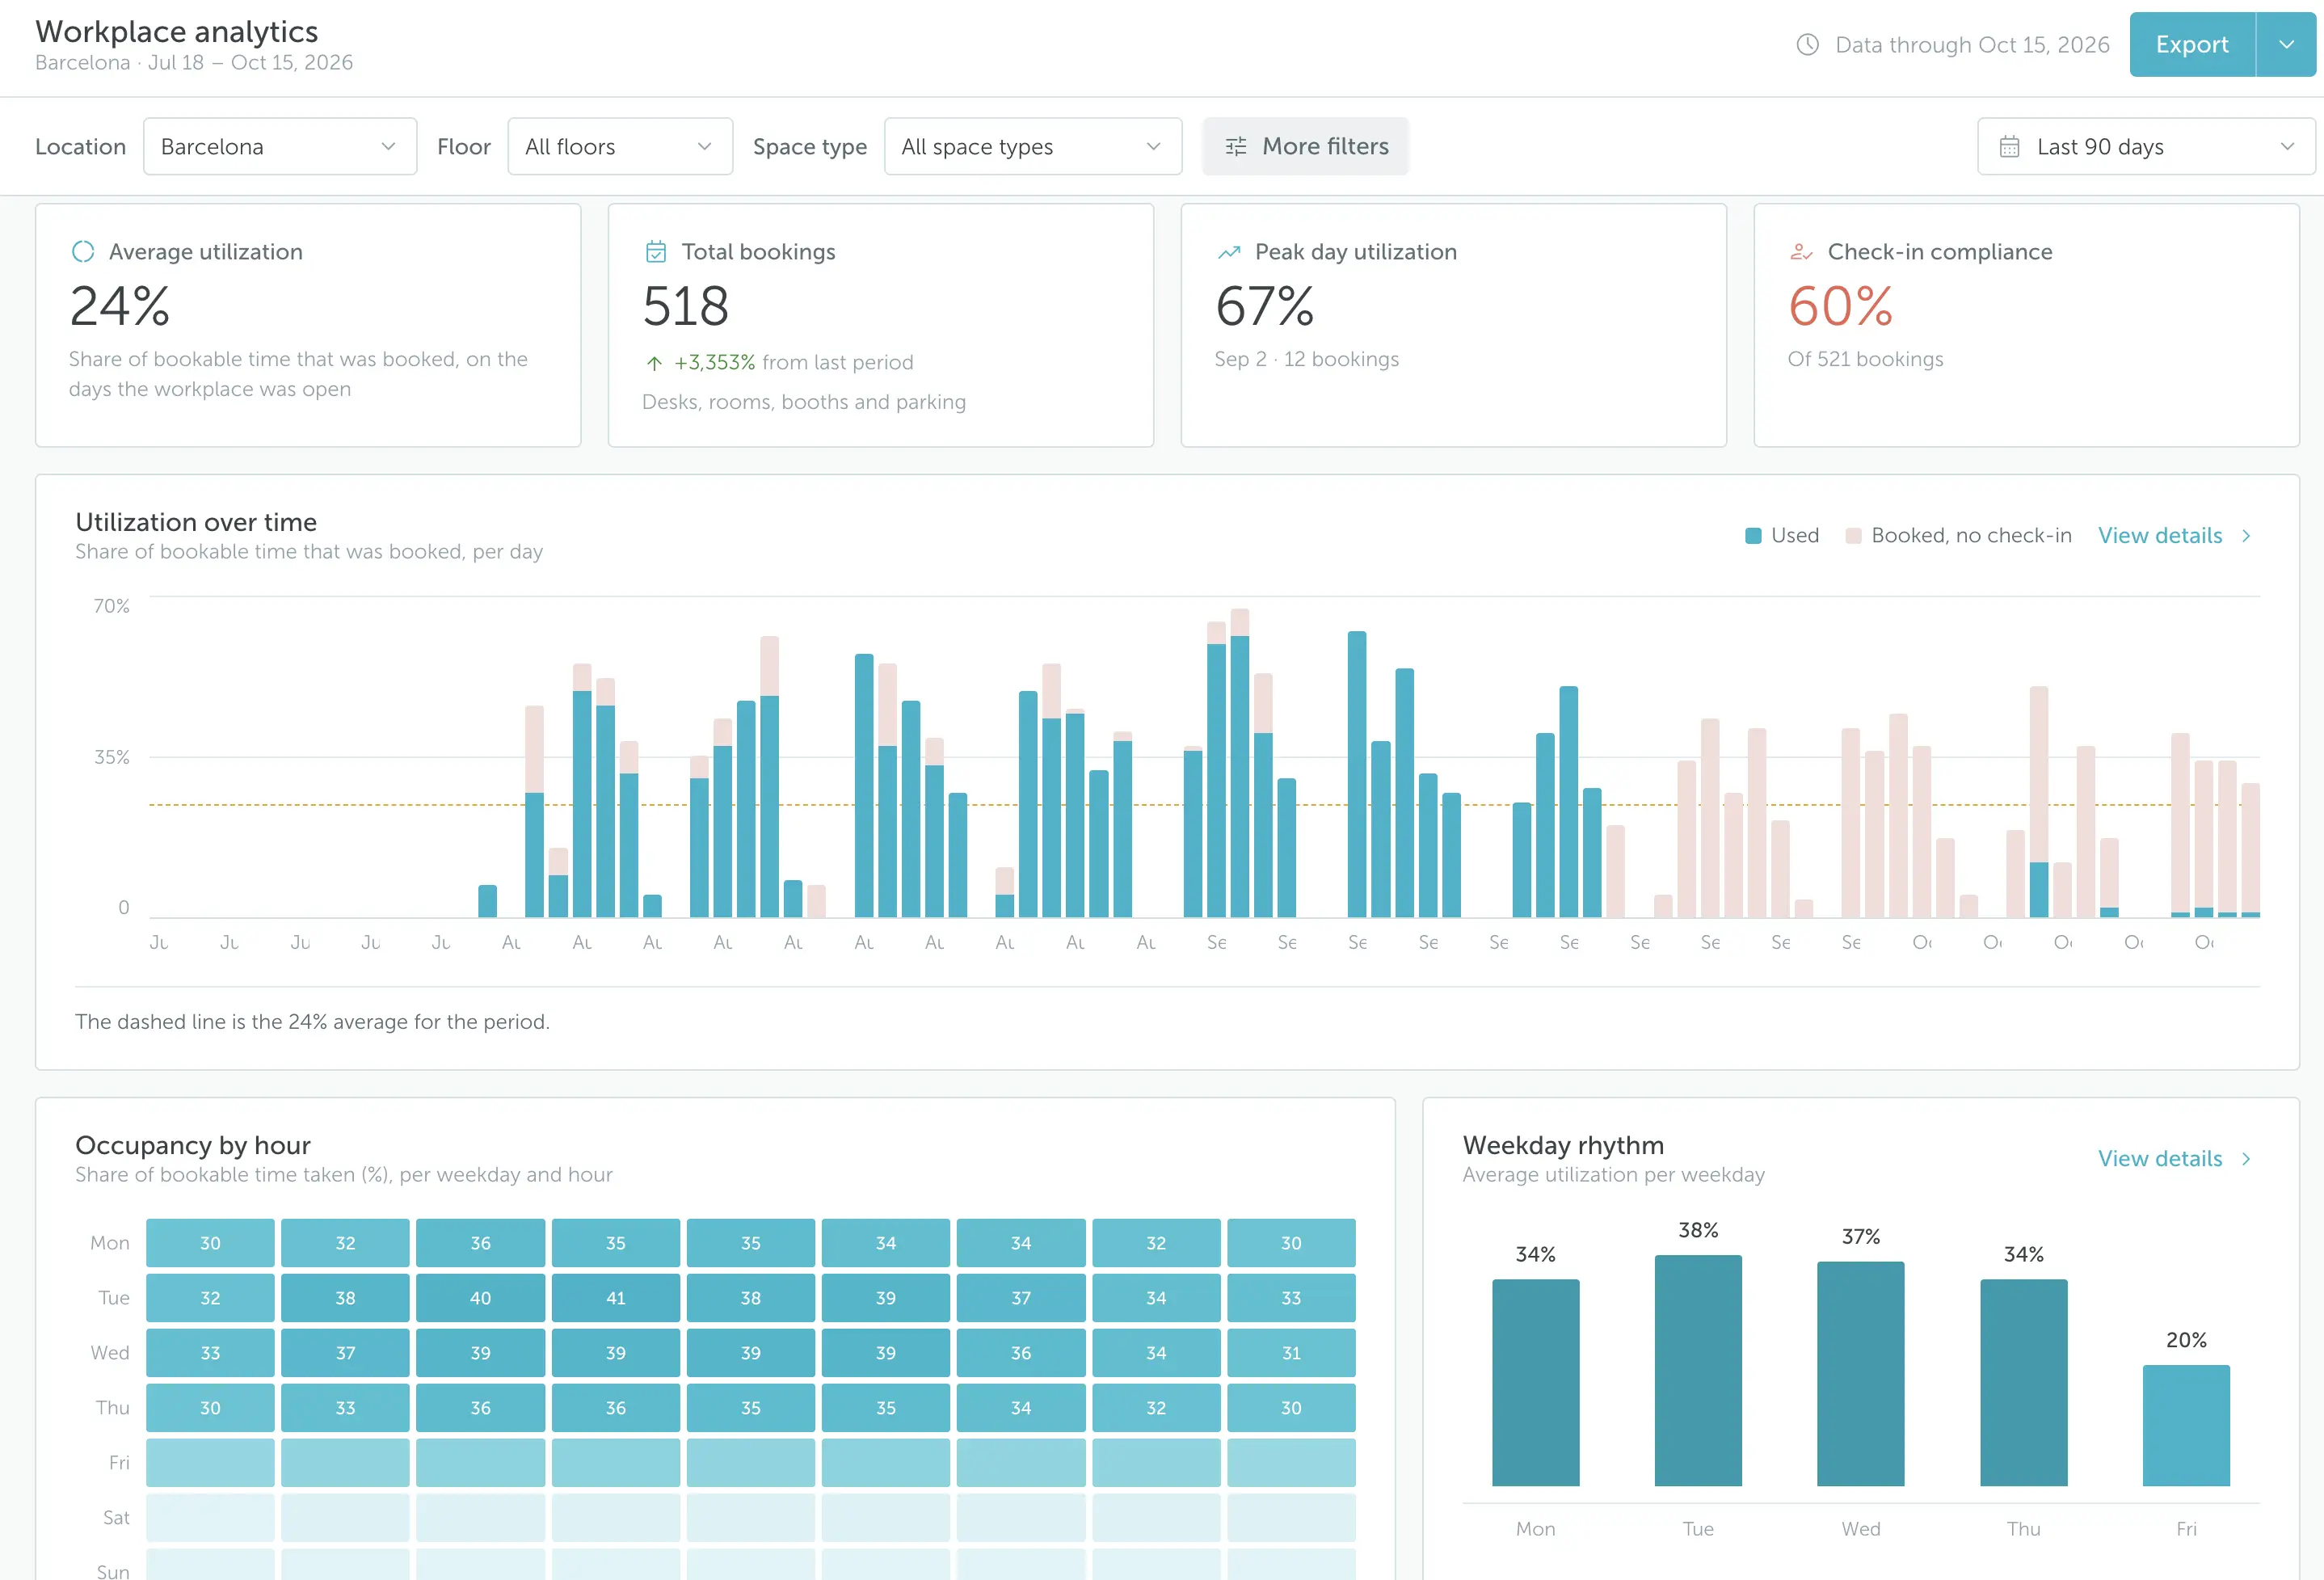
YAROOMS space utilization report with utilization metrics, daily utilization chart and occupancy heat map

Trusted by innovative organizations worldwide

Verizon
Dr. Martens
Columbia University
Dedalus
Cerved
ASEE
University of Sydney

Space utilization metrics in YAROOMS

The YAROOMS utilization report covers the following metrics for any location, floor, space type and period:

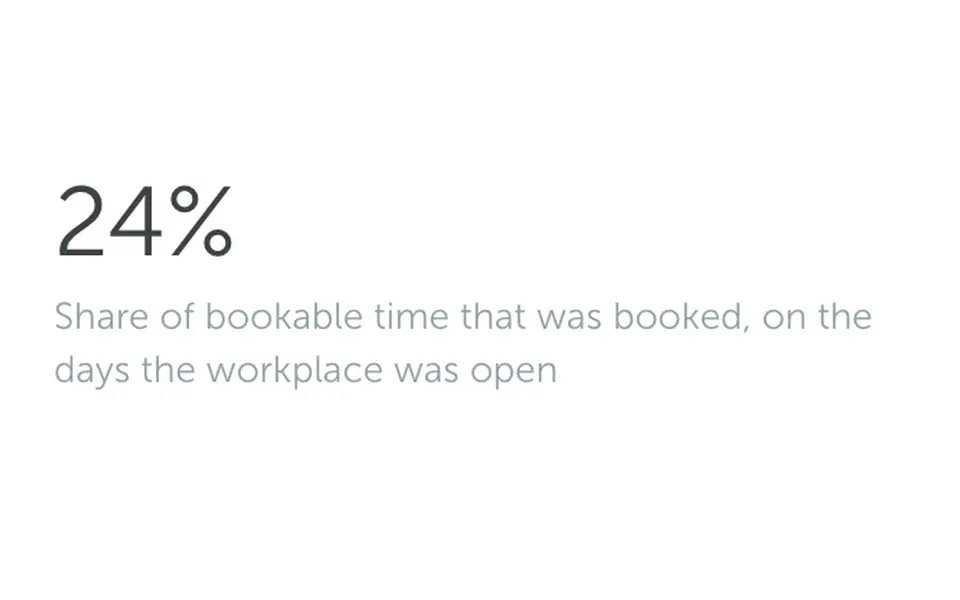
Average utilization of 24% in the YAROOMS report

Average utilization

Share of bookable time that was booked, on days the office was open

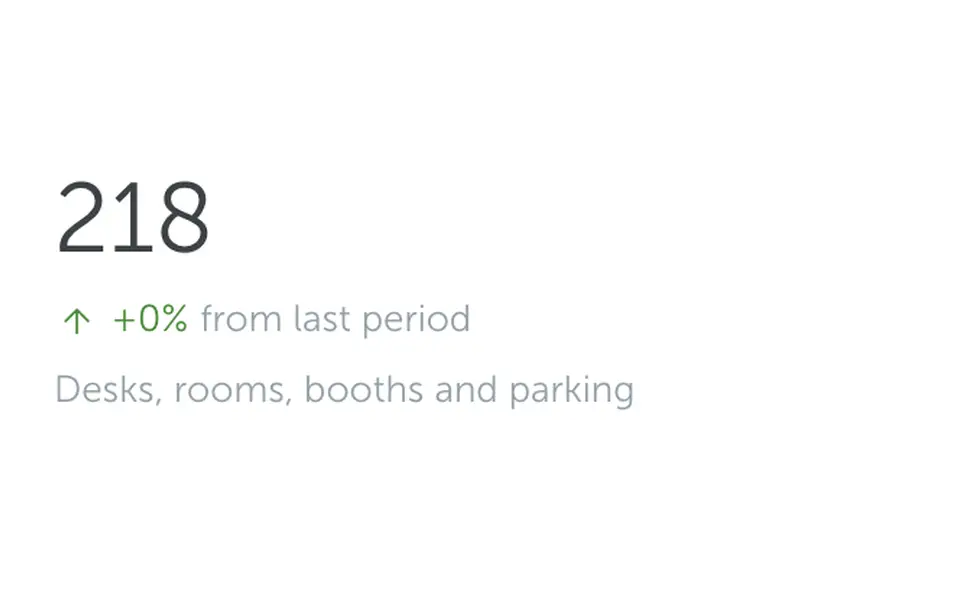
218 total bookings and comparison with the previous period

Total bookings

Desk, room, booth and parking bookings, vs the previous period
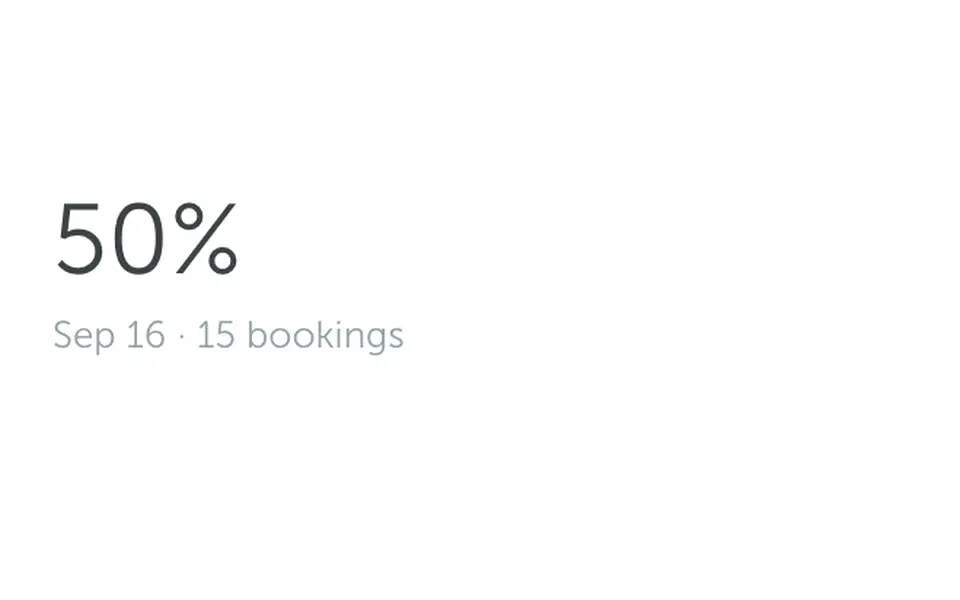
Peak day utilization of 50% with 15 bookings

Peak day utilization

The busiest day, its utilization and number of bookings
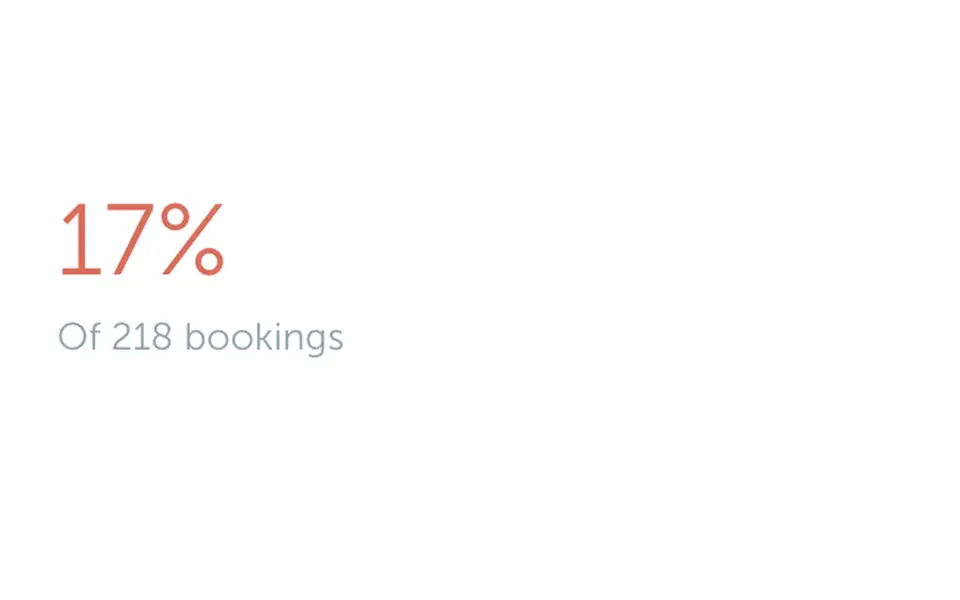
Check-in compliance of 17% across 218 bookings

Check-in compliance

Share of bookings that were checked into
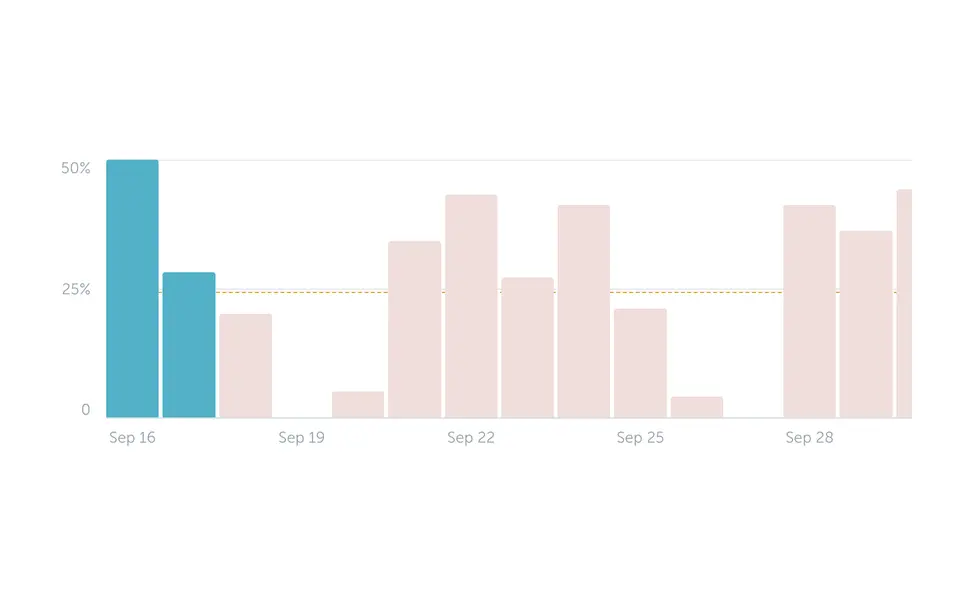
Daily utilization chart comparing used bookings with bookings without check-in

Utilization over time

Daily utilization, split into used and booked with no check-in
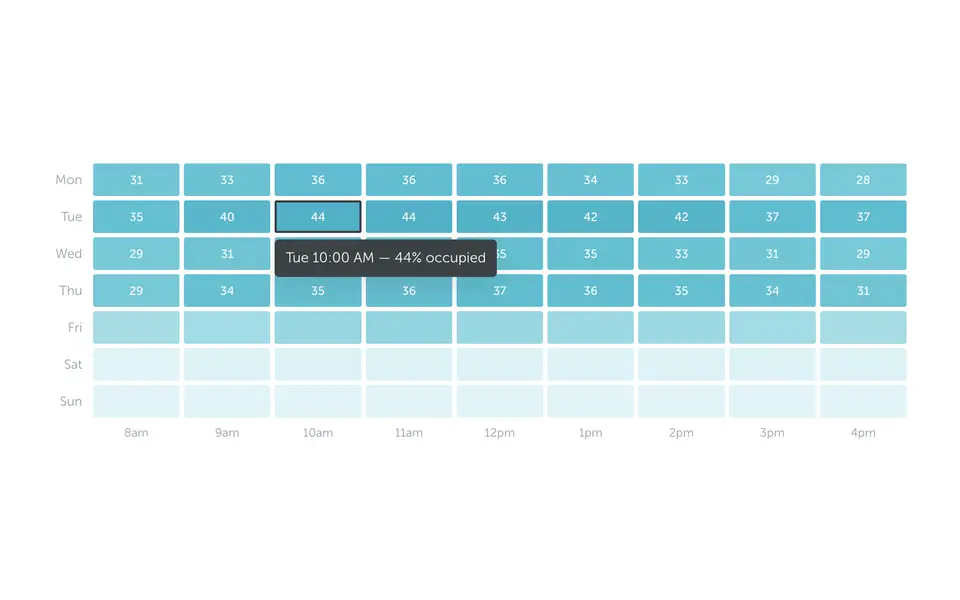
Occupancy heat map by weekday and hour

Occupancy by hour

Heat map of space taken per weekday and hour, with the peak slot
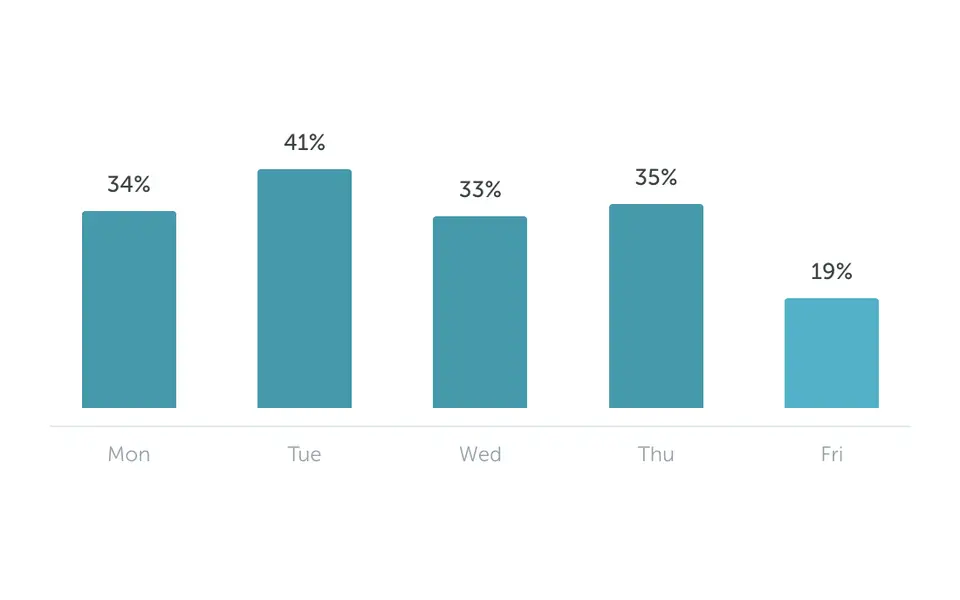
Average utilization for each weekday shown as a bar chart
Weekday rhythm

Average utilization for each weekday

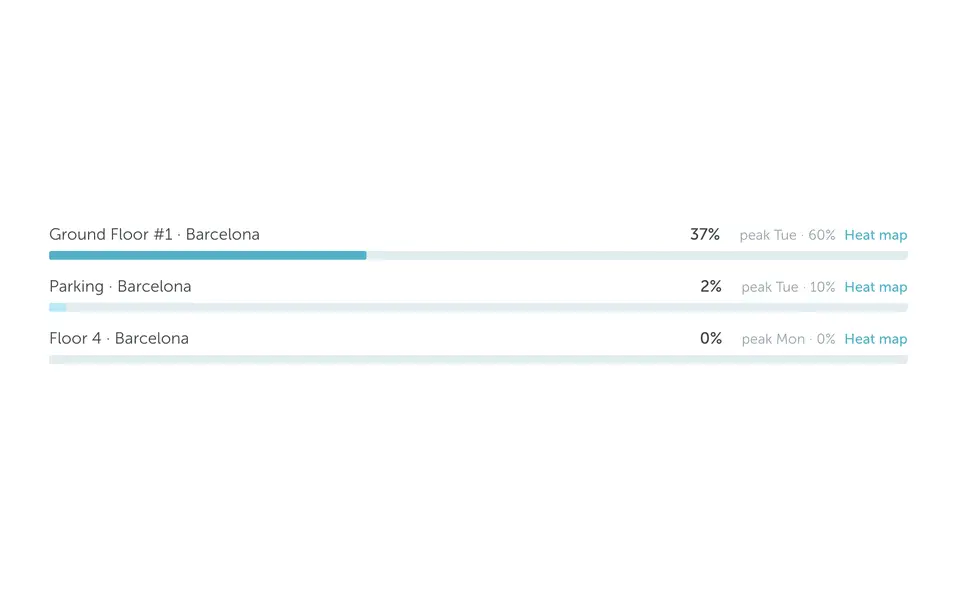
Floor utilization bars with average utilization and peak weekday

Floor utilization

Average, peak weekday and heat map for each floor
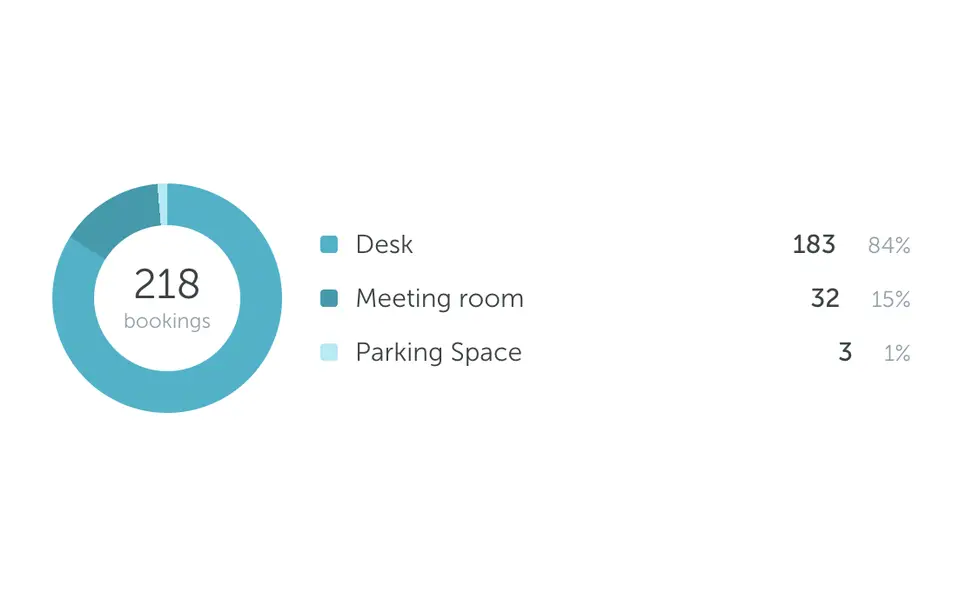
Booking distribution for desks, meeting rooms and parking

Bookings by space type

Booking count and share for desks, rooms, parking and more
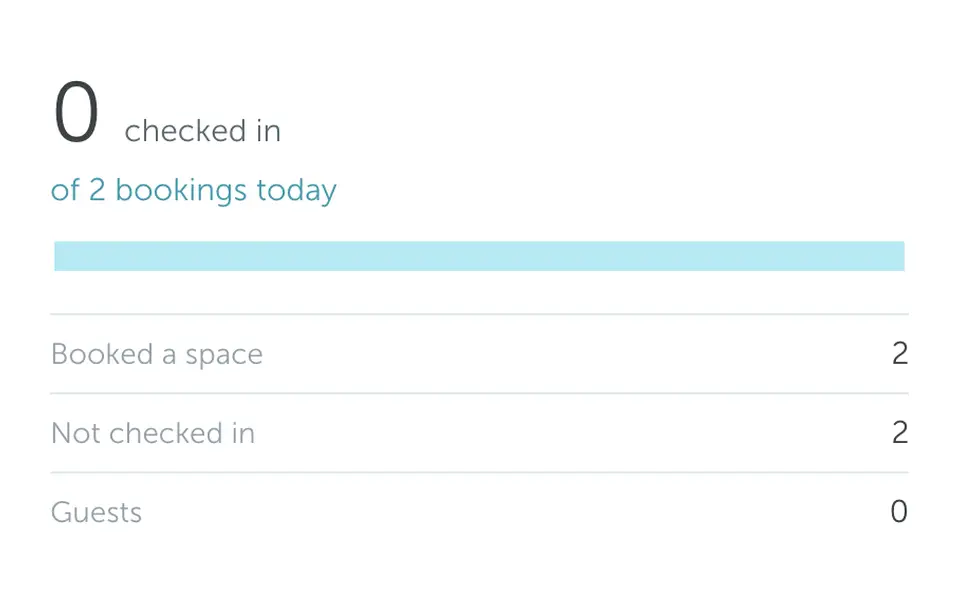
Today’s check-ins, bookings, no-shows and guests

In the office today

Today's check-ins vs bookings, no-shows and guests
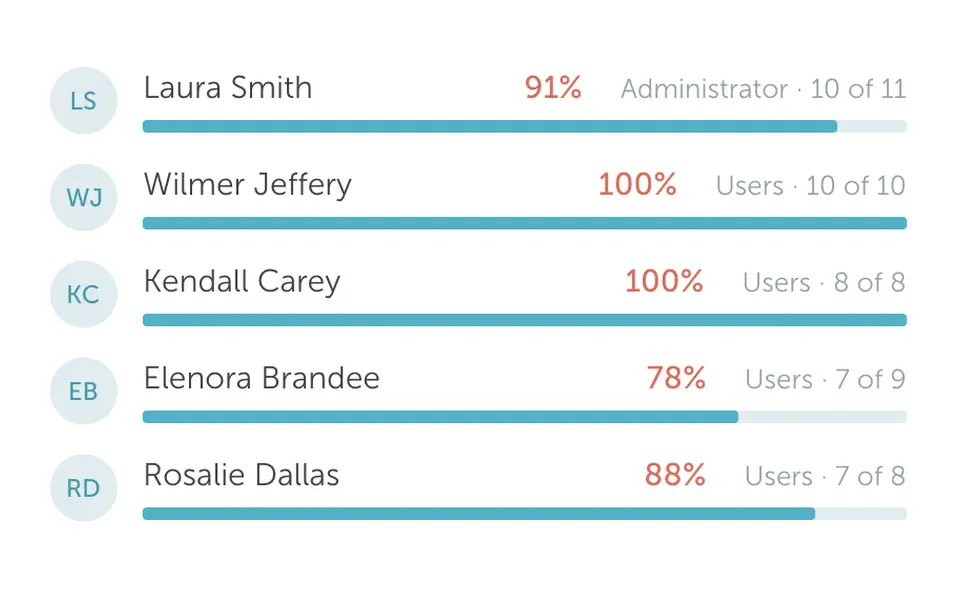
People with the most bookings without a check-in

Most no-shows

People who book most often without checking in
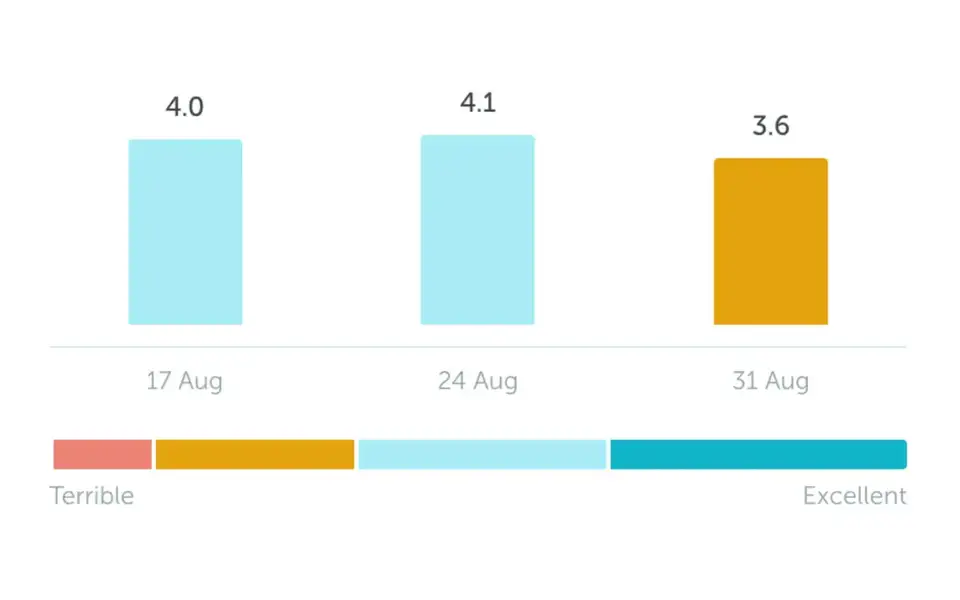
Weekly office satisfaction scores in the YAROOMS survey report

Satisfaction

Weekly office survey score (1–5), once the survey is on

Reduce no-shows with check-in data

YAROOMS links every booking to a check-in, so you see who books without showing up and how today’s check-ins compare with today’s bookings. Automatic release returns unused space to others.
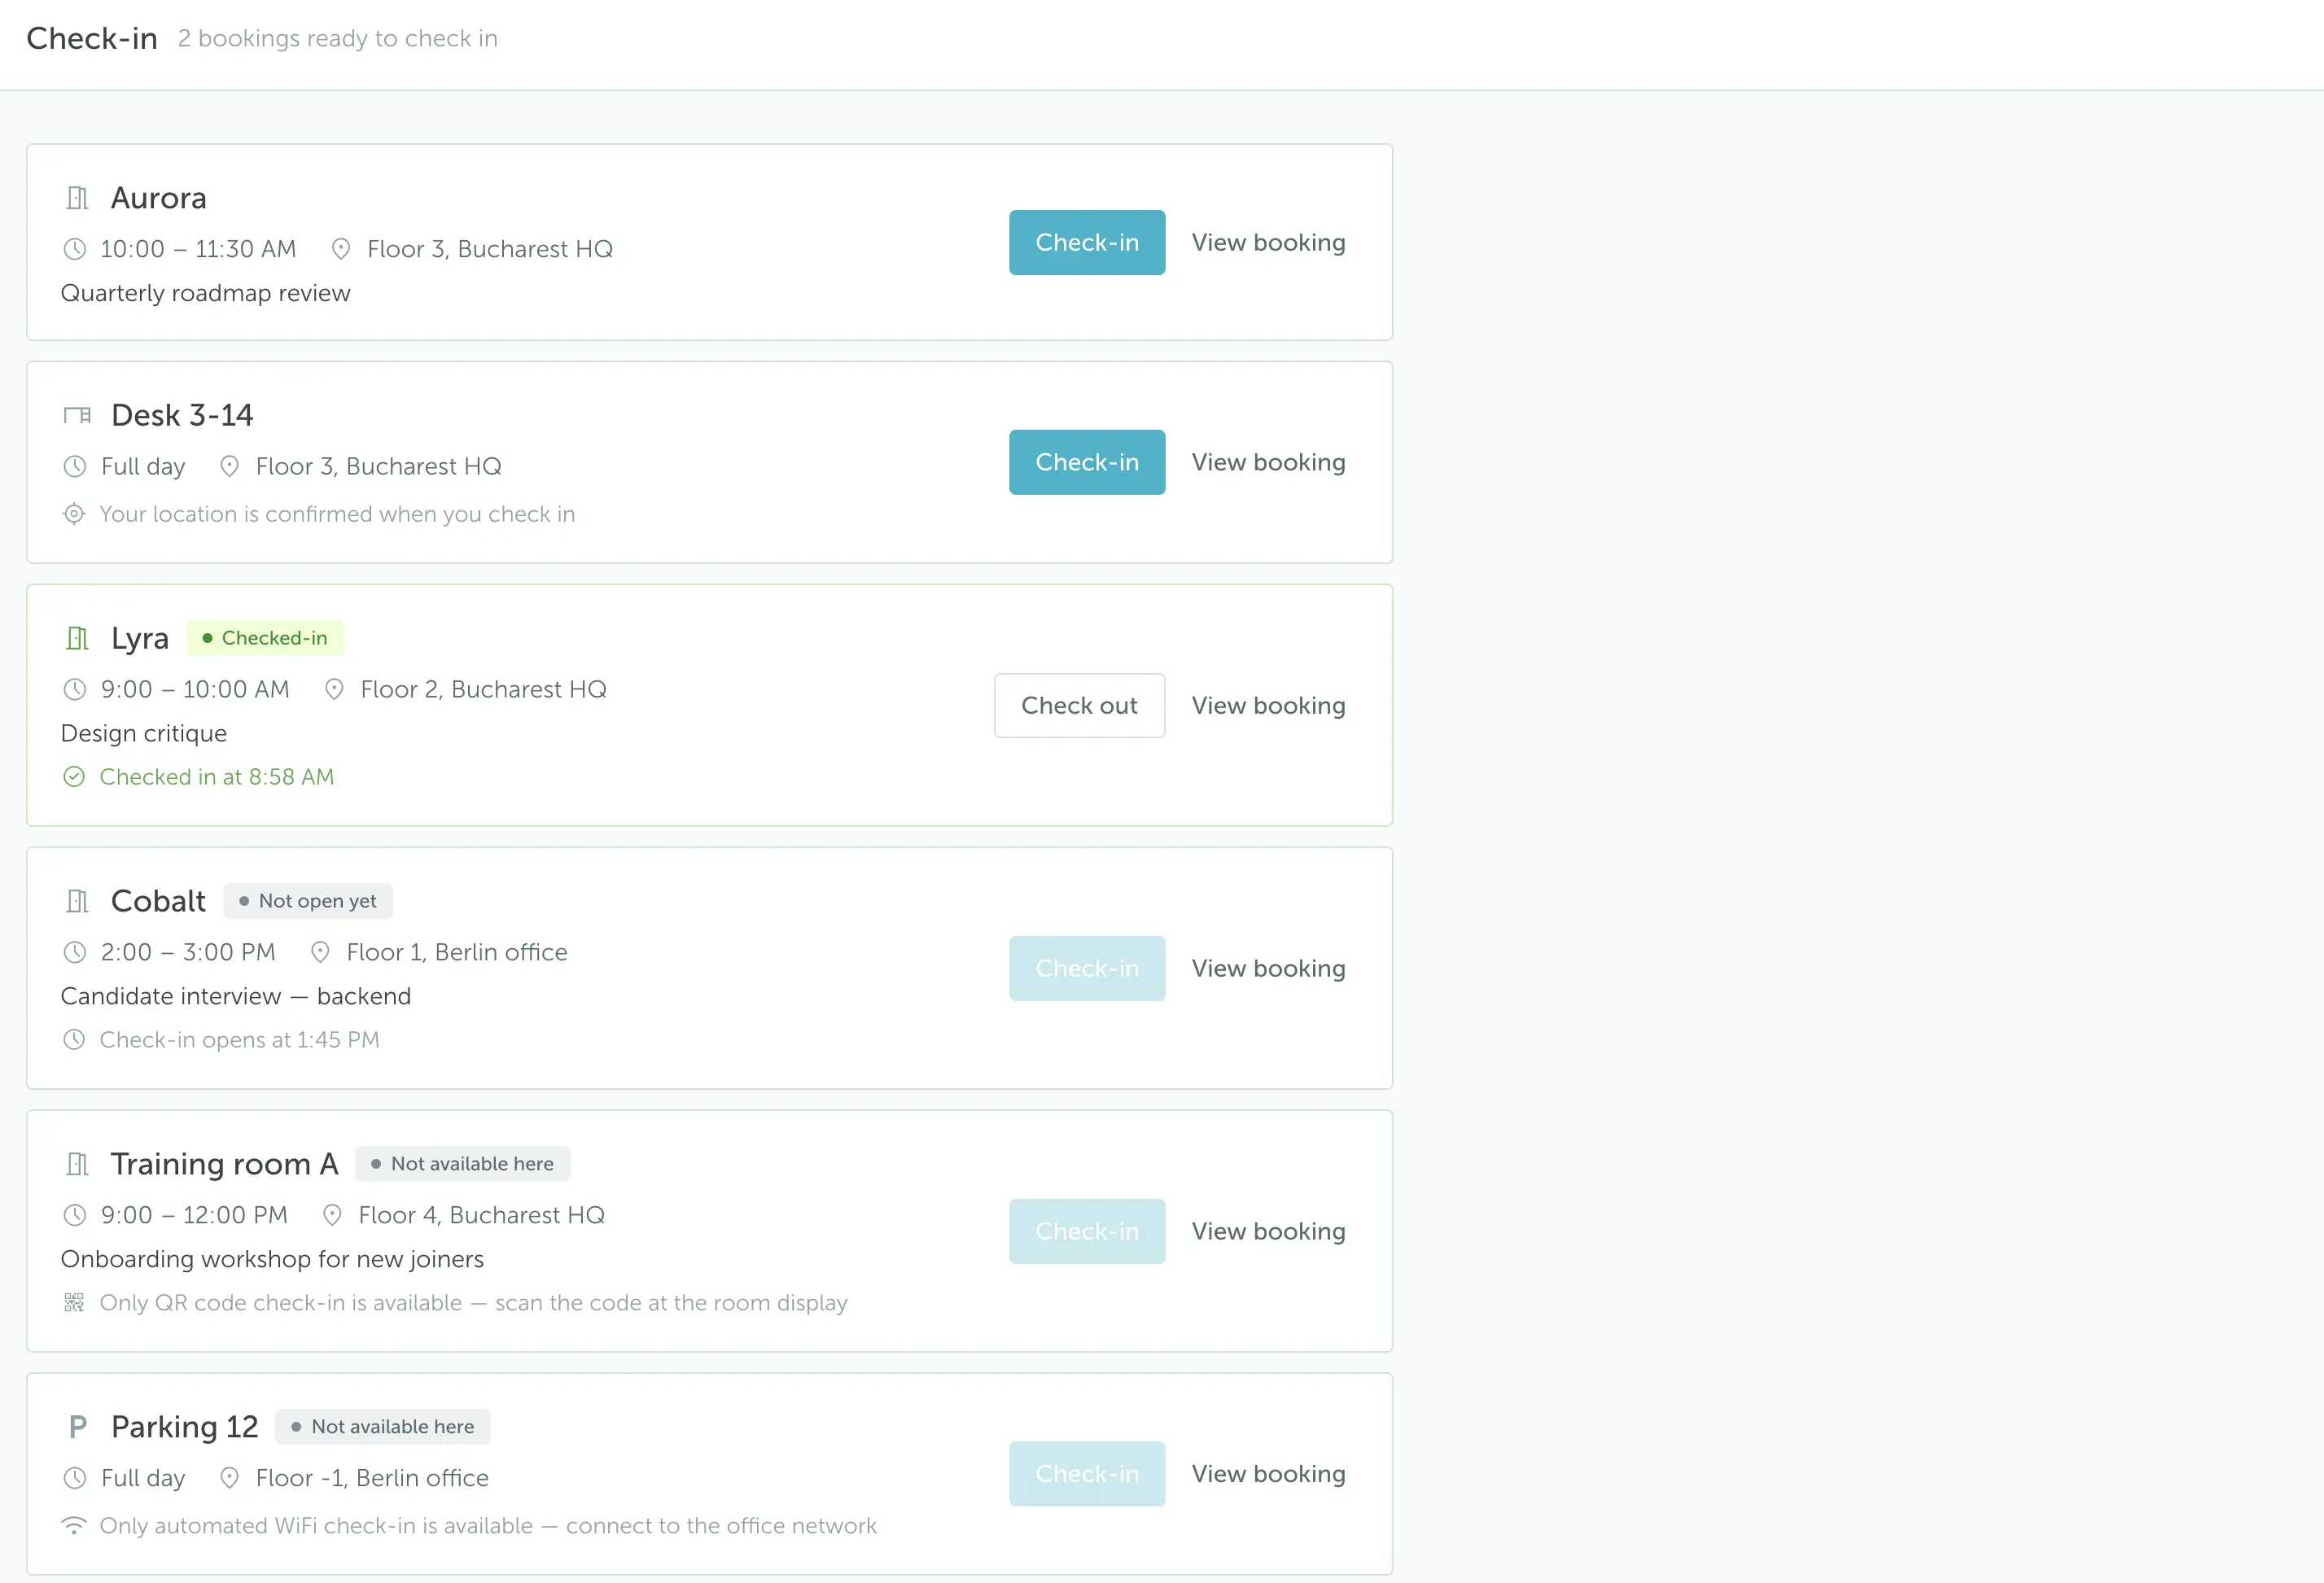
YAROOMS check-in page showing upcoming desk and room bookings and a confirmed check-in

Filter, export and track without sensors

Filter every YAROOMS report by location, floor, space type and date range, then export the data as CSV or XLSX. Choose the columns you need and export immediately or schedule the export.

Utilization comes from bookings and QR, Wi-Fi or geofence check-ins, so there is no hardware to install and no activity monitoring.

History: 90 days on Business, unlimited on Enterprise.
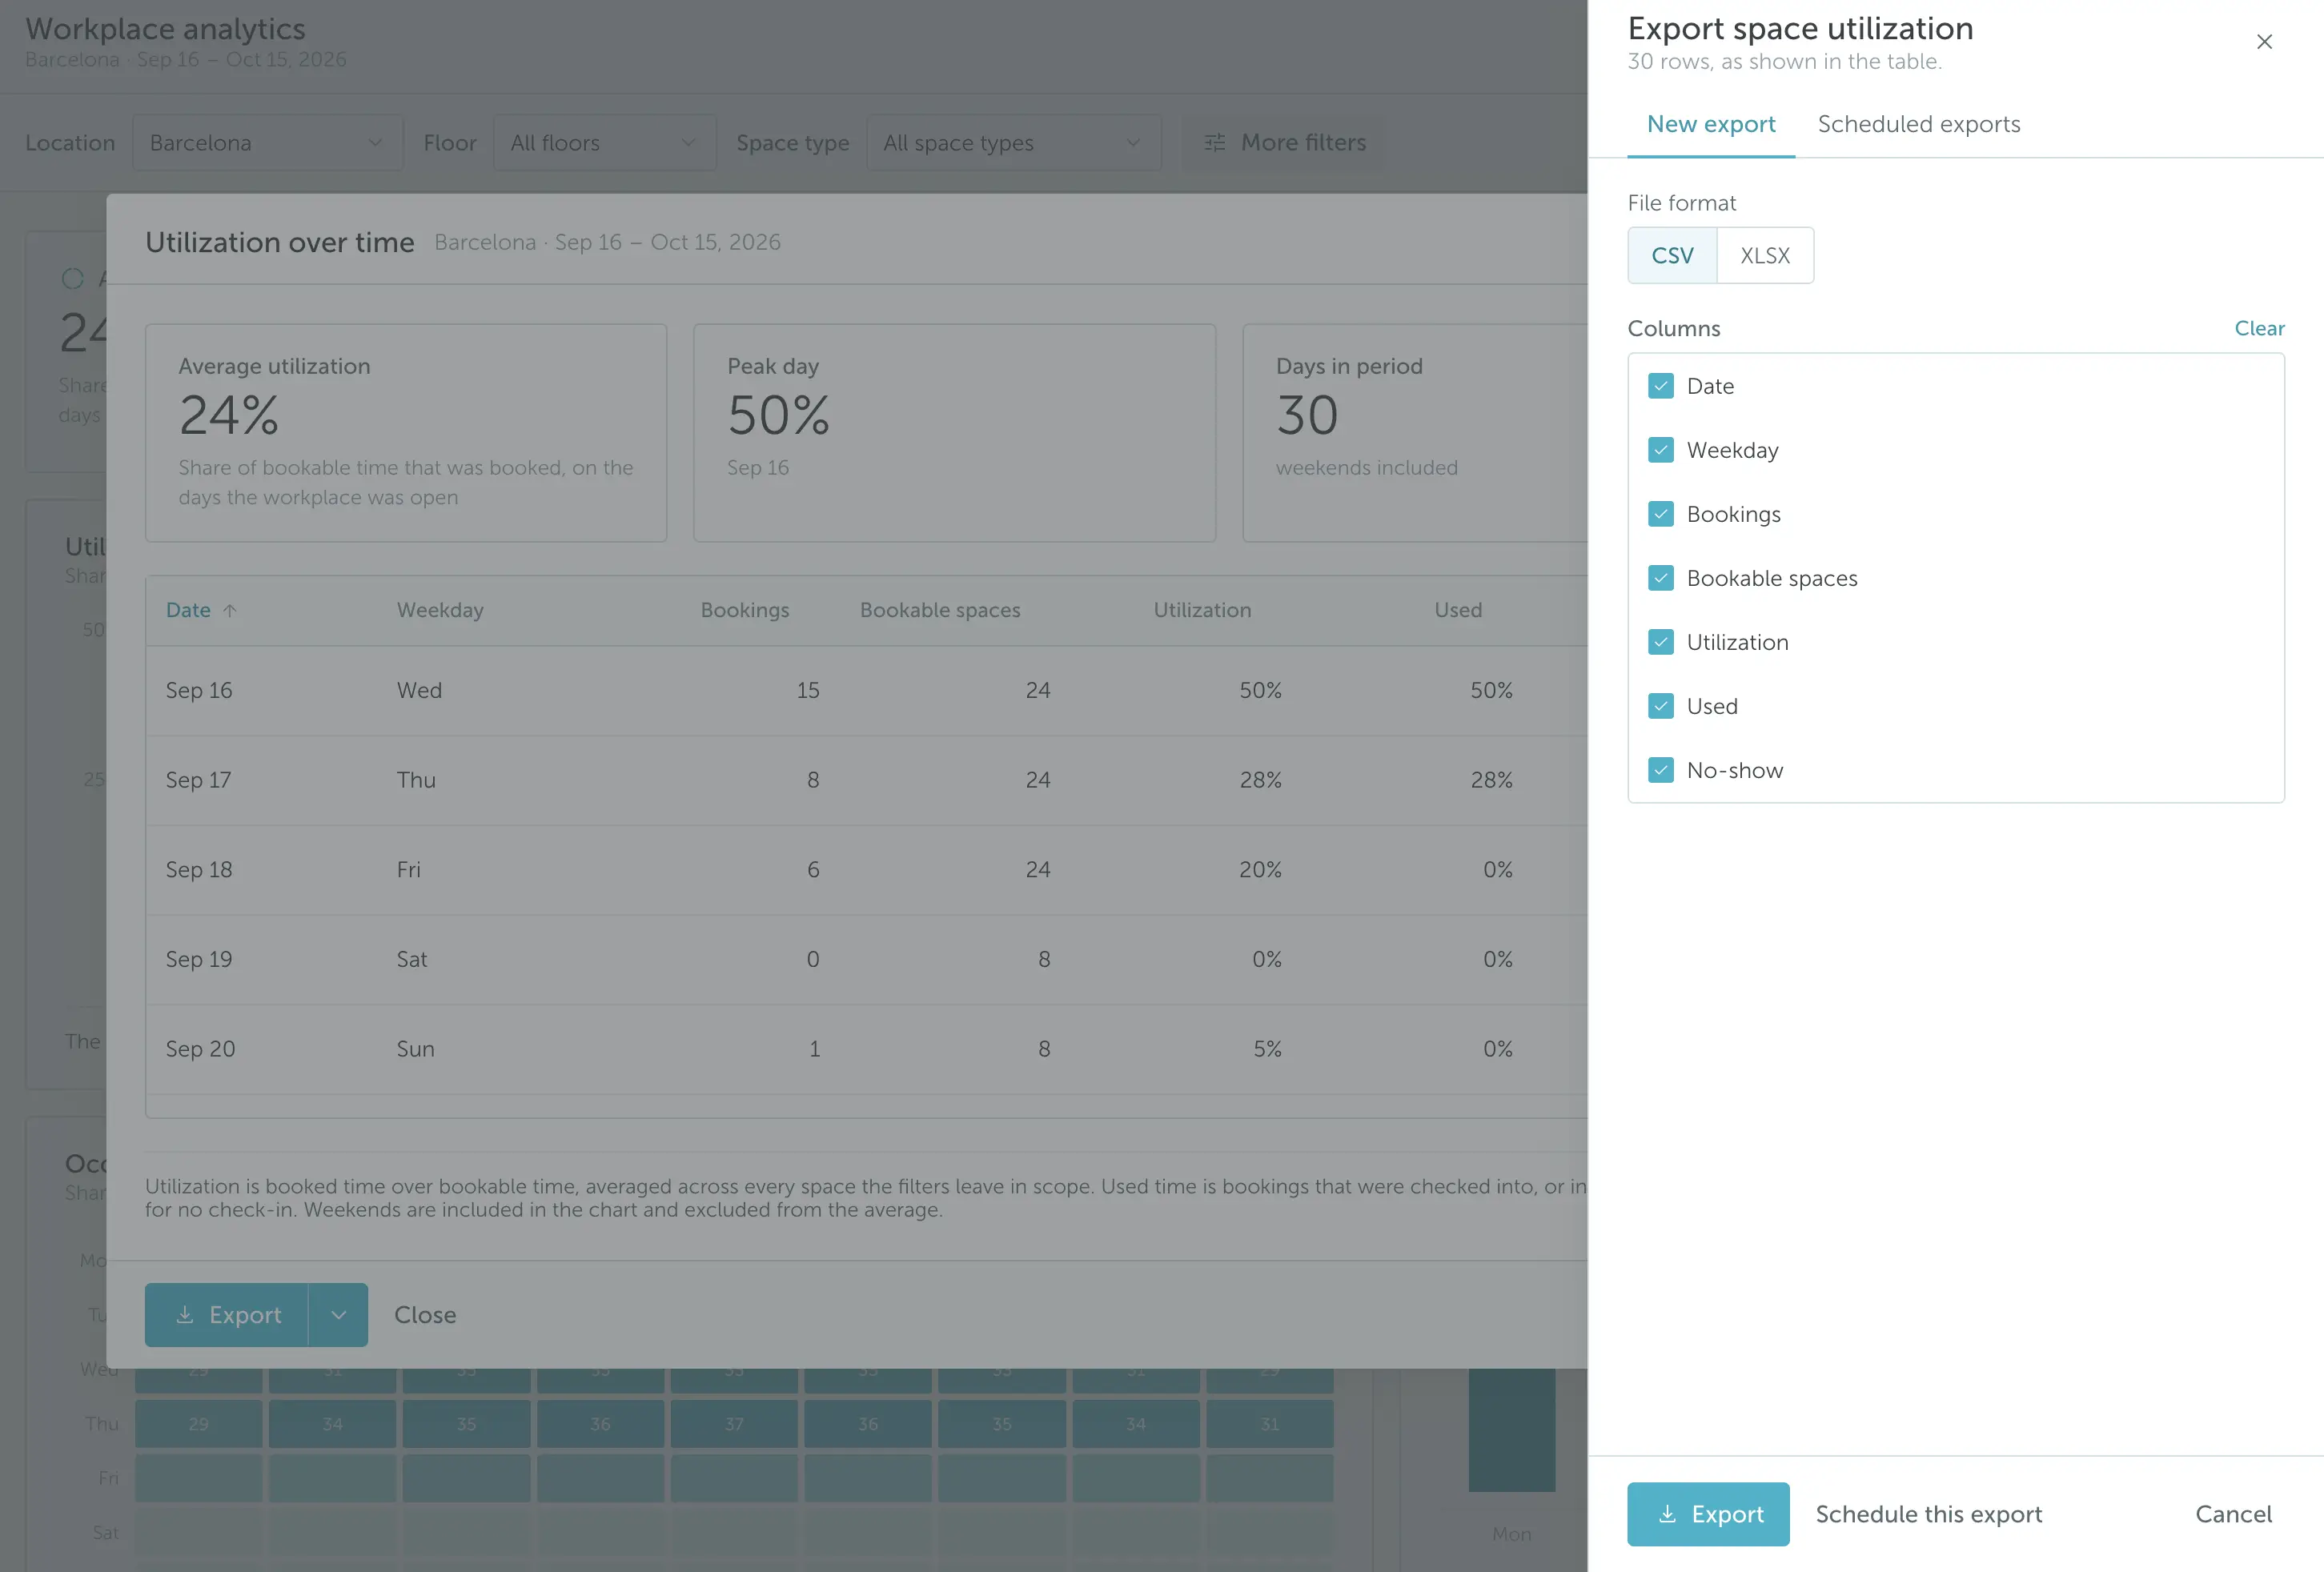
YAROOMS export panel with CSV and XLSX formats, column selection and scheduled exports

Space utilization analytics FAQ

Space utilization analytics measures how much of an office’s available space is actually used, by whom and when. YAROOMS space utilization analytics calculates this from desk, room and parking bookings and check-ins, then reports it by location, floor, space type, weekday and hour. Facilities and real estate teams use it to find underused floors, plan office days, reduce no-shows and size space for real demand instead of headcount.
YAROOMS calculates utilization as booked time divided by bookable time, on the days the workplace was open: Utilization = booked hours ÷ bookable hours × 100. For example, 50 desks bookable 9 hours a day over 20 open days give 9,000 bookable hours. If 2,700 hours were booked, utilization is 30%. YAROOMS also shows how much booked time was actually used, by comparing bookings with check-ins, so ghost bookings don’t inflate the number.
There is no single target, but JLL reported average global office utilization of 54% in 2025. The peak matters more than the average: an office averaging 40% may still run out of desks on Tuesdays. YAROOMS shows both the average and the peak day, plus a weekday and hour heat map, so teams can size space for the busiest day rather than the mean.
YAROOMS tracks 12 utilization metrics: average utilization, total bookings, peak day utilization, check-in compliance, utilization over time, occupancy by hour, weekday rhythm, floor utilization, bookings by space type, in the office today, most no-shows and office satisfaction. Every metric can be filtered by location, floor, space type and date range, and exported.
Office space utilization is measured with one of four data sources: booking system data, occupancy sensors, badge access logs or manual walk-through studies. YAROOMS uses bookings plus check-ins by QR code, Wi-Fi presence or geofencing, which shows both what was reserved and what was actually used, with no hardware. For a full step-by-step method, see the office space optimization guide.
Booking-based analytics, like YAROOMS, need no hardware and start working as soon as people book, but they miss walk-ins who never book. Occupancy sensors capture actual presence per desk or room, including walk-ins, but cost more to buy, install and maintain. Badge data shows who entered the building, not which space they used. Manual studies give a snapshot of a few days, not ongoing data. Many teams start with booking data and add sensors only where walk-in use is high.
Space utilization measures how much of the available space and time is used over a period, such as 40% of desk-hours in a month. Occupancy measures how many people are in a space at a given moment, compared with its capacity. YAROOMS reports both: utilization over time, and occupancy by hour on a weekday heat map.
No. YAROOMS calculates utilization from bookings and check-ins, so there are no sensors, cameras or badge integrations to install. Employees check in by QR code, Wi-Fi presence or geofencing, which confirms the booked space was used. YAROOMS does not collect keystrokes, app usage, screen activity or camera feeds.
YAROOMS shows a heat map for each floor on the floor plan, highlighting busy and underused zones for the selected period. The floor utilization view lists every floor with its average utilization and busiest weekday, and links straight to that floor’s heat map. A separate occupancy heat map shows usage by weekday and hour across the location.
Yes. Every YAROOMS utilization report filters by space type, so desks, meeting rooms, booths and parking can be analyzed on their own or together. Bookings by space type shows how demand splits across them, and check-in data shows where meeting rooms or desks are booked but not used.
Yes. Every YAROOMS utilization report can be exported as CSV or XLSX, with your choice of columns. You can export immediately or schedule exports. Analytics history is 90 days on the Business plan and unlimited on Enterprise, so longer-term trend reporting needs Enterprise or regular exports.

See your own office in the YAROOMS utilization report

We use cookies to analyze traffic and improve your experience.

Cookie preferences

Essential

Required for the site to function

Always on
Analytics

Help us understand how visitors use the site

Marketing

Used to deliver relevant ads

Talk to Sales or Support