
Visitor analytics and visitor management reporting
See how many guests visit each office, when they arrive, how many never show up and how many come back. Filter by location, visitor type and date, then export the data.
Rated 4.6/5 from 102 reviews on Capterra
Last updated: September 26, 2026
What is visitor analytics?
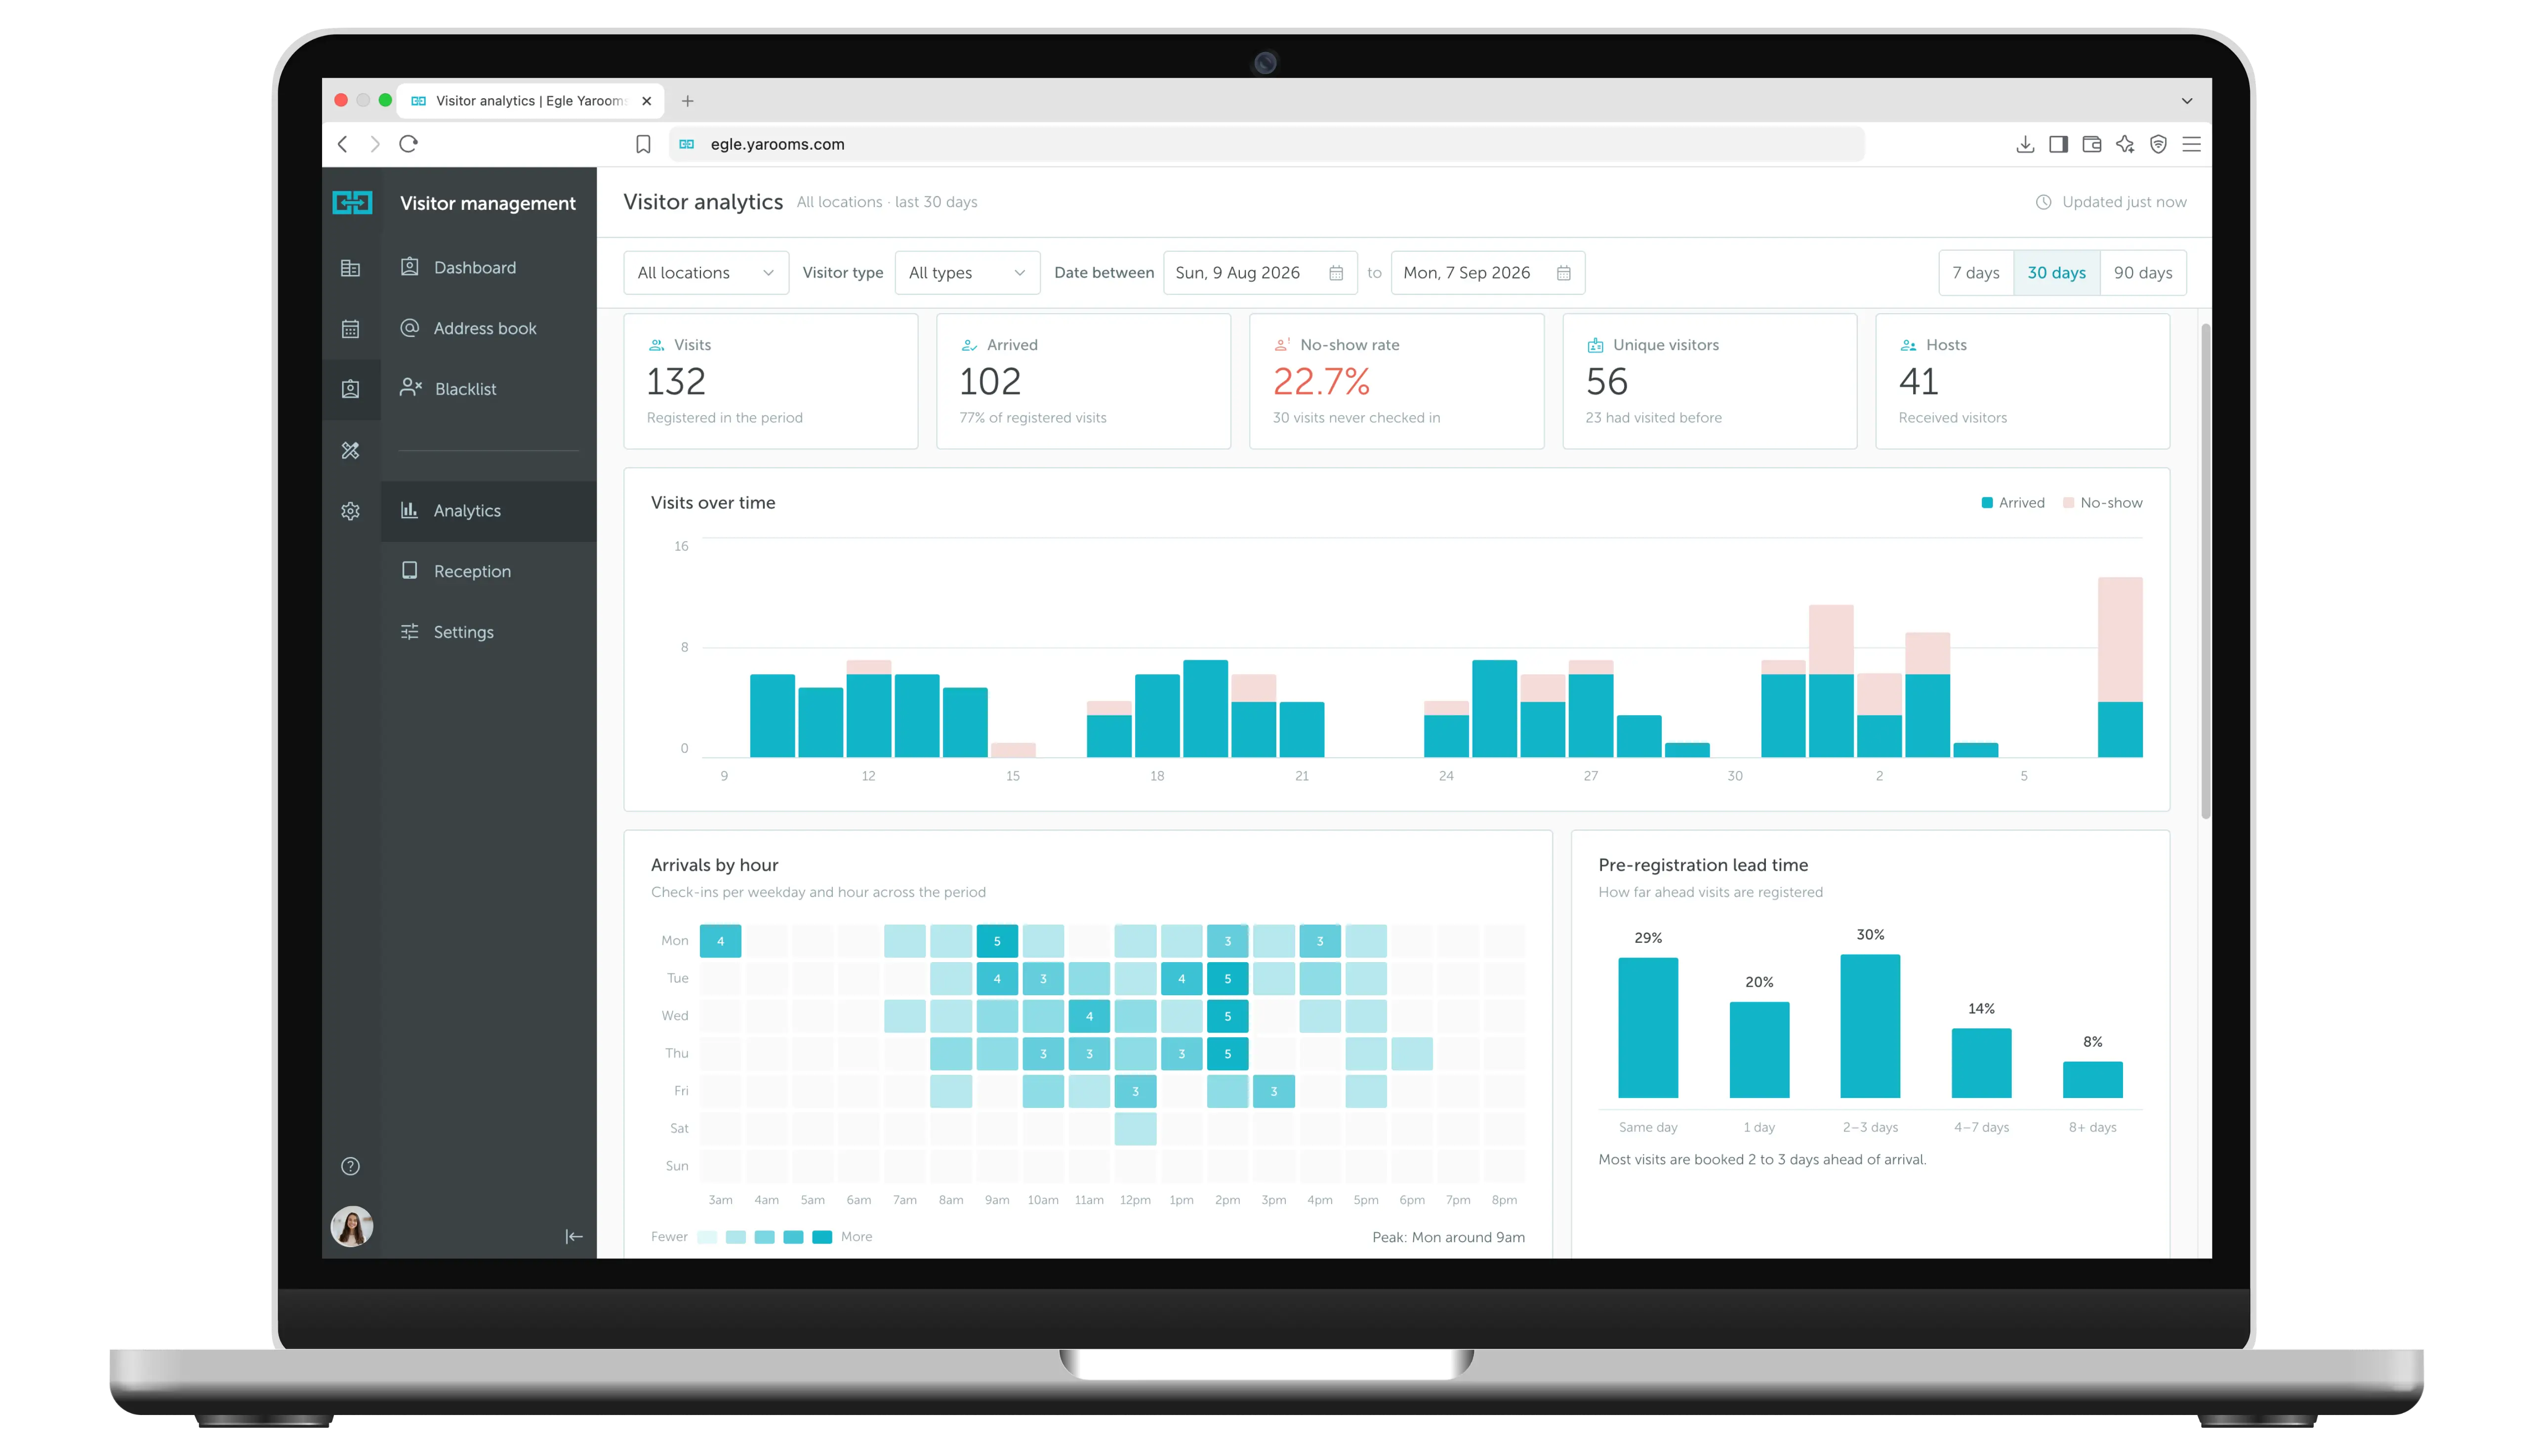
Visitor analytics turns individual visit records into trends. In YAROOMS, the Visitor analytics view shows registered visits, arrivals, no-show rate, unique and repeat visitors, and the number of hosts. Charts show visits over time, arrivals by weekday and hour, and pre-registration lead time. You filter by location, visitor type and date range.
Key takeaways
- The Visitor analytics view summarizes visits, arrivals, no-show rate, unique visitors and hosts for the period you choose.
- An arrivals-by-hour heatmap shows the peak check-in time for each weekday.
- Filters cover location, visitor type and date range, with 7, 30 and 90 day presets.
- Visitor data exports to CSV, and access to visitor analytics is a separate role permission per location.
Trusted by innovative organizations worldwide







See it in action
Take a quick tour of visitor management and see how visitor data turns into reports you can act on.
One dashboard for visitor numbers across your offices
The Visitor analytics view (Visitor Management → Analytics) puts the key visitor numbers for the selected period at the top of the page. Choose all locations or one, a visitor type and a date range.
Visits and arrivals
See how many visits were registered in the period and how many visitors actually arrived.
No-show rate
See the share of registered visits that never checked in.
Unique and repeat visitors
Count distinct visitors and see how many of them had visited before.
Hosts
See how many employees received visitors in the period.
Visitor traffic trends show when reception is busy
Charts in the Visitor analytics view show how visitor traffic changes by day and by hour. Use them to plan reception staffing, meeting room demand and parking.
Visits over time
A daily chart splits registered visits into arrivals and no-shows.
Arrivals by hour
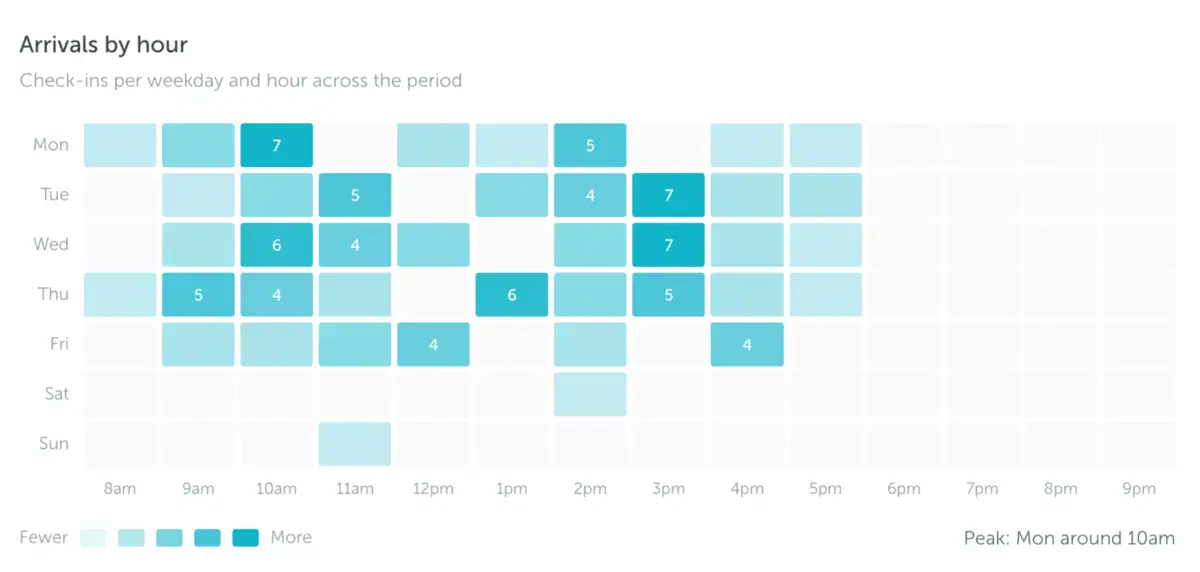
A heatmap shows check-ins per weekday and hour, and names the peak time.
Pre-registration lead time
See how far ahead hosts register their visits, from same day to eight or more days.
See who visits, who hosts and which offices are busiest
Rankings and breakdowns in the Visitor analytics view show where visitor demand comes from, so security, reception and facilities teams can plan for it.
Top hosts
Rank the employees who receive the most visitors, with visit counts and share, up to the top 20.
Busiest locations
Compare visits and no-show rate for each office side by side.
Top visiting companies
See which companies send the most visitors in the period.
Visits by type
See the mix of visitor types, with the no-show rate for each type.
Repeat vs first-time
Split visitors into first-time guests and returning visitors.
Peak concurrency
See the most visitors on site at once, and the typical daily peak, for each location.
Visitor reports and exports for audits and planning
Visitor data leaves YAROOMS in the formats that security, facilities and finance teams already use.
CSV export
Export the visitor log to CSV in one click for audits or further analysis.
Presence report
List everyone present at a location on a day or date range, with check-in and check-out times.
Scheduled exports
Send workplace analytics reports, such as the Presence report, to an email address at a fixed frequency.
Enterprise-grade security
Your data is protected with industry-leading certifications


Key benefits of visitor analytics
Visitor analytics next to desk, room and attendance data
YAROOMS is one platform for desk booking, room booking, visitor management, digital reception, signage, parking and service requests. Visitor analytics sits beside the other workplace analytics reports: utilization, people, presence, services, satisfaction and hybrid work.
Visitors that employees book desks or rooms for also appear in the workplace analytics reports. This shows visitor demand in the same place as employee demand for space.
Visitor analytics and the digital visitor log
Visitor analytics answers questions about trends: how many visitors, when they arrive and how often they return. The digital visitor log answers questions about single visits: who came, who hosted them and when they left.
Both use the same visit records from visitor registration and check-in at the digital reception app.
FAQ: Visitor analytics
Answers to common questions about visitor analytics and visitor management reporting in YAROOMS.
YAROOMS has two visitor views. The Visitor Management dashboard lists visits by day, with columns you choose: name, status, type, host, company, check-in time, check-out time, car plate number and more. It also has a filterable purpose of visit column.
The Visitor analytics view summarizes a period: visits, arrivals, no-show rate, unique visitors, repeat visitors and hosts. It adds charts for visits over time, arrivals by hour, pre-registration lead time and peak concurrency, and rankings of top hosts, busiest locations, visitor types and top visiting companies.
YAROOMS gives you these visitor reports:
- Visitor analytics: visit counts, no-show rate, unique and repeat visitors, visits over time, arrivals by hour, pre-registration lead time, peak concurrency, top hosts, busiest locations, visits by type and top visiting companies
- Visitor Management dashboard: the daily list of visits, exportable to CSV
- Presence report: everyone present at a location on a day or date range, including registered visitors, with check-in and check-out times
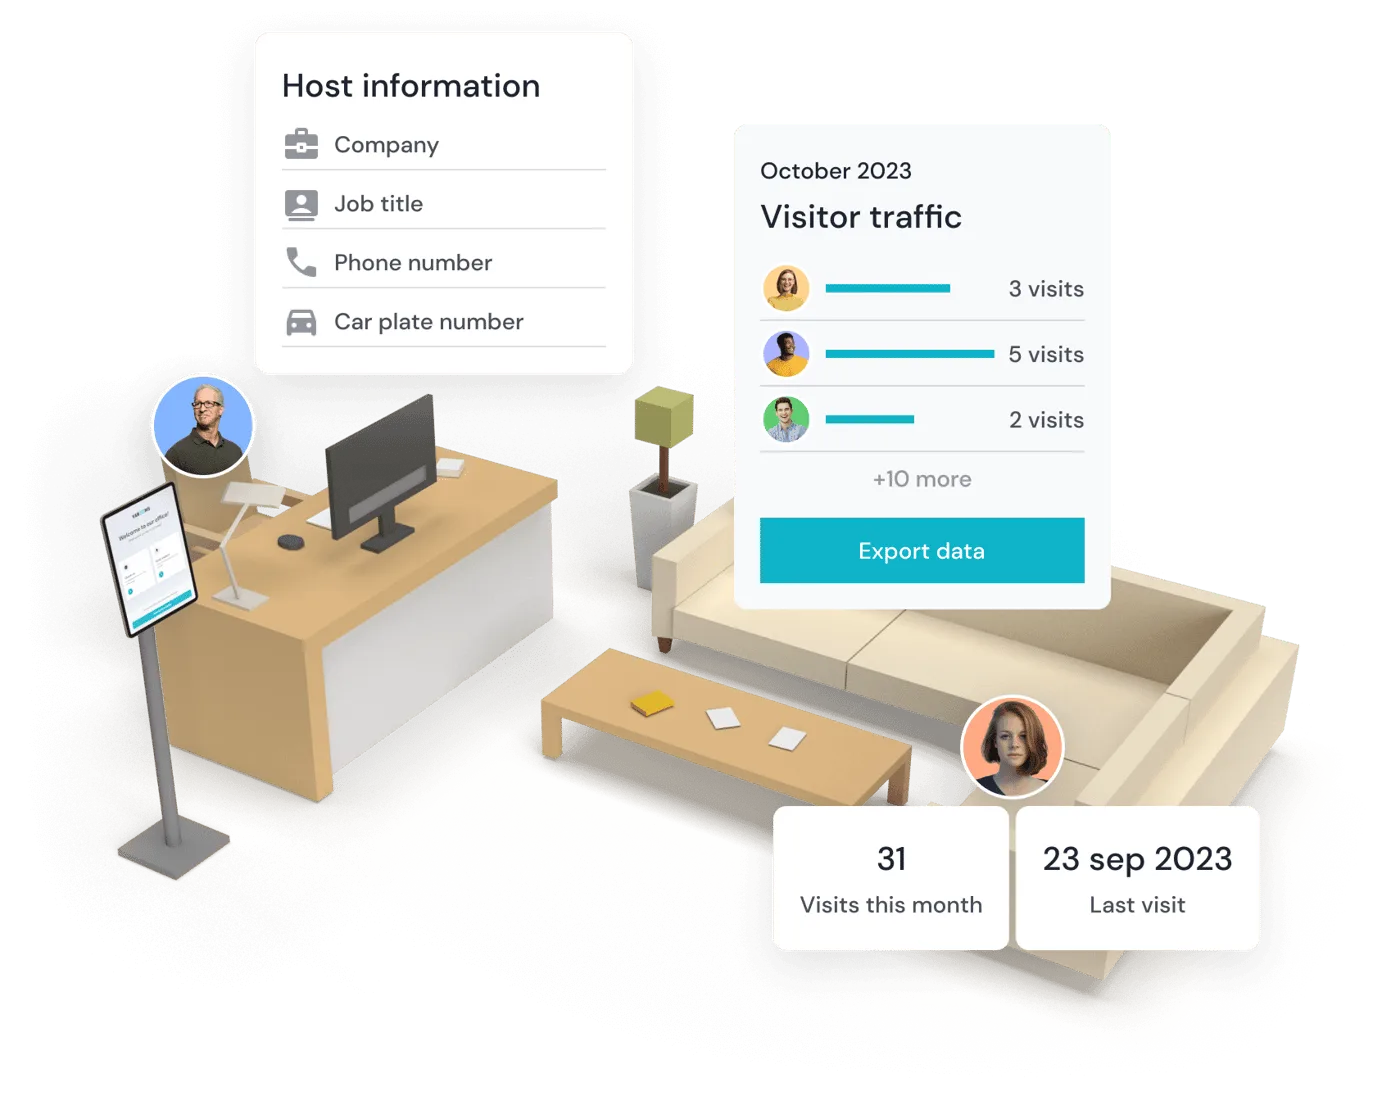
- Address book: for each contact, the number of visits this month and the date of the last visit
Yes. The Busiest locations chart compares visits and no-show rate for each office in the selected period. The location filter also narrows every chart to one office, so you can compare peak arrival times and visitor types location by location.
Administrators see the dashboards for all company locations. Reception staff generally see only the dashboard for their own location.
Yes. Export the visitor log to CSV in one click. Workplace analytics reports, including the Presence report, have an Export CSV button and can be sent by email on a schedule. The Presence report can also be printed, for example as an evacuation list.
Administrators can see visitor analytics for every location. Other users need a role with access to the Visitors analytics category. Administrators grant it per location under Settings → Manage Users → Roles → Module access. You can give a reception manager visitor analytics for one office without access to other reports.
A no-show is a registered visit that never checked in. The no-show rate is the share of registered visits in the period that never checked in. Unique visitors counts each person once, and the dashboard shows how many of them had visited before.
You can filter by location, by visitor type and by a custom date range. Presets for the last 7, 30 and 90 days make quick comparisons easy.
See visitor analytics in action
See how organizations use YAROOMS to manage visitors and the entire workplace. Join a Live Demo or watch the On-demand Platform Tour.
Related Products
Office Visitor Management System
Office visitor management system with pre-registration, QR and kiosk check-in, badge printing, host alerts, NDA signing and a searchable visitor log.
Digital Reception
YAROOMS Digital Reception is a digital reception system and visitor check-in system for tablets and kiosks: self check-in, checkout, badges and host alerts.
Digital Visitor Log
A digital visitor log book that replaces the paper visitor book. Record every office visit, check-in and check-out time, and export audit-ready CSV reports.
We use cookies to analyze traffic and improve your experience.
Cookie preferences
Required for the site to function
Help us understand how visitors use the site
Used to deliver relevant ads